The Indian economy exhibited resilience during 2024-25, supported by robust macroeconomic fundamentals and proactive policy measures, amidst persisting geopolitical tensions and geoeconomic fragmentation. Headline inflation moderated, although the pace of disinflation was impeded by elevated and volatile food inflation. Deposit and credit exhibited double digit growth. Fiscal consolidation continued both at the centre and state level. The continued strength of the external sector, as reflected in adequate forex reserves and modest current account deficit, supported macroeconomic and financial stability. II.1.1 The global economic expansion was steady in 2024 albeit uneven, amidst geopolitical tensions, geoeconomic fragmentation and heightened trade tensions. Financial conditions turned less restrictive as major central banks embarked on monetary policy easing. Global GDP grew by 3.3 per cent in 2024 (3.5 per cent a year ago)1. Global inflation eased to 5.7 per cent in 2024 from 6.6 per cent a year ago as the effect of monetary tightening took hold along with the easing of supply chain pressures; however, it was still above the pre-pandemic average, with elevated services inflation persisting in some major advanced economies. Pandemic-induced fiscal policy measures and gradual fiscal consolidation continued to exert upward pressure on the global public debt-GDP ratio, which is expected to approach 100 per cent by 20302. Global goods and services trade volume growth recovered to 3.8 per cent in 2024 from 1.0 per cent in 20233, supported by strong services trade growth and normalising of supply chains. Global financial markets exhibited bouts of volatility over inflated valuations, uncertain trajectory of monetary policy, disinflation losing pace, rising trade tensions and geopolitical risks. Sovereign bond yields softened in the first half of 2024 to rise again during the second half of the year. The US dollar remained firm through the year, putting downward pressure on other advanced economy (AE) and emerging market economy (EME) currencies. II.1.2 Against this challenging global economic landscape, the Indian economy remained resilient, supported by robust macroeconomic fundamentals and proactive policy measures. Although real gross domestic product (GDP) growth moderated to 6.5 per cent4 in 2024-25, India remained the fastest growing large economy. Economic activity was bolstered by an improvement in consumption demand and net exports on the expenditure side and buoyant services sector and recovery in agricultural production on the supply side. II.1.3 Headline inflation moderated further during 2024-25. While food inflation remained volatile and elevated, core disinflation in both goods and services and deflation in fuel contributed to softening of headline inflation, paving the way for progressive alignment of headline inflation with the target. II.1.4 Both central and state governments pursued fiscal consolidation during 2024-25. The tax receipts of both central and state governments remained robust. On the capital expenditure front, the central government and states recorded modest growth on a year-on-year basis. II.1.5 Domestic financial markets broadly evolved in an orderly manner during 2024-25. Money market rates largely remained range-bound, and generally aligned with the policy repo rate even as system liquidity oscillated between surplus and deficit conditions. Issuances of certificates of deposit (CDs) increased as credit growth remained robust, although there was narrowing of the gap between credit and deposit growth. Sovereign bond yields softened steadily in H1:2024-25 on fiscal consolidation, inclusion of Indian government bonds (IGBs) in major global bond indices and decline in crude oil prices. However, they exhibited two-way movements in the latter half of the year and fell sharply after the Reserve Bank initiated the policy easing cycle in the February policy meeting. Equity market registered strong gains in the first half of the year before correcting in H2:2024-25. A modest current account deficit and adequate forex reserves imparted resilience to the external sector even as capital flows exhibited volatility. II.1.6 Against this backdrop, the rest of the chapter is structured into six sections. An analysis of the real economy is presented in section 2 followed by that of inflation and its drivers in section 3. The developments in monetary aggregates and financial markets are presented in sections 4 and 5, respectively. The evolution of government finances (centre and states) is discussed in section 6, and external sector dynamics are covered in section 7. II.2 THE REAL ECONOMY II.2.1 The Indian economy exhibited resilience in 2024-25, supported by robust macroeconomic fundamentals and proactive policy measures. Economic activity recovered in H2:2024-25 from the trough in Q2:2024-25, supported by buoyant rural demand, recovery in government expenditure, improved agriculture sector and resilient services sector activity. The financial system remains sound and well-capitalised, underpinned by the healthy balance sheets of financial institutions and corporates. II.2.2 An assessment of aggregate demand and its major components is etched out in sub-section 2. The developments in aggregate supply conditions in terms of the performance of agriculture, industry and services are presented in sub-section 3. Employment and labour market dynamics are discussed in sub-section 4, with concluding observations in sub-section 5. 2. Aggregate Demand II.2.3 Aggregate demand – measured by GDP at constant prices – is estimated to have grown by 6.5 per cent in 2024-25, as compared with 9.2 per cent a year ago (Table II.2.1 and Appendix Table 1). While growth in consumption expenditure and export demand accelerated during the year, that in fixed investment recorded a moderation (Appendix Table 2). In terms of quarterly trajectory, real GDP rose (y-o-y) by 6.5 per cent in Q1:2024-25; growth softened to 5.6 per cent in Q2, inter alia, on excess rainfall which dampened mining output and electricity demand and restrained government expenditure5. The economy, however, picked up momentum in Q3 to grow by 6.2 per cent (Chart II.2.1). | Table II.2.1: Real GDP Growth | | (Per cent) | | Component | 2020-21 | 2021-22 | 2022-23 | 2023-24 | 2024-25 | | 1 | 2 | 3 | 4 | 5 | 6 | | I. Total Consumption Expenditure | -4.6 | 9.8 | 7.0 | 5.9 | 7.1 | | Private | -5.3 | 11.7 | 7.5 | 5.6 | 7.6 | | Government | -0.8 | 0.0 | 4.3 | 8.1 | 3.8 | | II. Gross Capital Formation | -10.6 | 25.4 | 3.5 | 7.3 | 5.8 | | Gross Fixed Capital Formation | -7.1 | 17.5 | 8.4 | 8.8 | 6.1 | | Change in Stocks | -76.4 | 525.4 | 24.3 | 53.4 | 4.3 | | Valuables | 29.9 | 32.5 | -16.9 | 14.4 | 1.0 | | III. Net Exports | | | | | | | Exports | -7.0 | 29.6 | 10.3 | 2.2 | 7.1 | | Imports | -12.6 | 22.1 | 8.9 | 13.8 | -1.1 | | IV. GDP | -5.8 | 9.7 | 7.6 | 9.2 | 6.5 | | Source: NSO. | Consumption II.2.4 Growth in private final consumption expenditure (PFCE) – the main component of aggregate demand – improved to 7.6 per cent in 2024-25, buoyed by rural consumption demand even though urban demand exhibited some moderation. The share of PFCE in real GDP increased to 56.7 per cent in 2024-25. Good agricultural performance boosted rural demand as seen from its proximate indicators, viz., sales of two-wheelers, motorcycles and tractors, and volume growth of fast-moving consumer goods (FMCG) companies in rural areas. Urban demand, after remaining the driver of post-pandemic consumption, lost pace as reflected in indicators such as consumer non-durables, retail passenger vehicle sales and FMCG volumes in urban areas. Government final consumption expenditure (GFCE) grew at a modest 3.8 per cent in 2024-25, following a robust expansion of 8.1 per cent during 2023-24. With exports growth outpacing that of imports, net exports contributed positively to GDP growth (Chart II.2.2).  Investment and Saving II.2.5 The rate of gross domestic investment in the Indian economy, measured by the ratio of gross capital formation (GCF) to GDP at current prices, declined to 31.4 per cent in 2023-24 from 32.6 per cent in the preceding year, wholly due to a reduction in net capital inflow from the rest of the world (ROW), which fell to 0.7 per cent of GDP in 2023-24 from 2.0 per cent in the previous year. Available information for 2024-25 indicates an easing in growth of constituents of GCF. Growth in gross fixed capital formation (GFCF) – a primary component of GCF – moderated to 6.1 per cent in 2024-25 from 8.8 per cent in the previous year. It may be noted that government capital outlay (Centre and states6 combined) declined by 2.7 per cent (y-o-y) during 2024-25 (up to February 2025) as compared with a growth of 31.2 per cent in the corresponding period of 2023-24. The softening in GFCF was mirrored in its key coincident indicators, including steel consumption, cement production, and production and imports of capital goods (Chart II.2.3). Seasonally adjusted capacity utilisation (CU) of the manufacturing sector at 75.3 per cent in Q3:2024-25 was higher than the preceding quarter and its level in the corresponding quarter a year ago7. As per the results of the Reserve Bank’s 109th industrial outlook survey (IOS), manufacturing firms reported an improvement in demand conditions in Q4:2024-25. 
 II.2.6 Gross domestic saving as per cent to gross national disposable income (GNDI) remained steady at 30.3 per cent in 2023-24 primarily due to a decline in general government’s dissaving. Further, as against the increase in household liabilities to 6.1 per cent of GNDI, the gross financial saving of households increased to 11.2 per cent of GNDI in 2023-24 from 10.7 per cent in the previous year. Resultantly, household financial saving (net) improved to 5.1 per cent of GNDI in 2023-24 from 4.9 per cent in the previous year (Table II.2.2 and Appendix Table 3). | Table II.2.2: Financial Saving of Household Sector | | (Per cent of GNDI) | | Item | 2014-15 | 2015-16 | 2016-17 | 2017-18 | 2018-19 | 2019-20 | 2020-21 | 2021-22 | 2022-23 | 2023-24 | | 1 | 2 | 3 | 4 | 5 | 6 | 7 | 8 | 9 | 10 | 11 | | A. Gross Financial Saving | 9.9 | 10.7 | 10.4 | 11.9 | 11.8 | 11.4 | 15.2 | 10.9 | 10.7 | 11.2 | | of which: | | | | | | | | | | | | 1. Currency | 1.0 | 1.4 | -2.1 | 2.8 | 1.4 | 1.4 | 1.9 | 1.1 | 0.9 | 0.4 | | 2. Deposits | 4.8 | 4.6 | 6.3 | 3.0 | 4.2 | 4.3 | 6.2 | 3.5 | 4.1 | 4.5 | | 3. Shares and Debentures | 0.2 | 0.2 | 1.1 | 1.0 | 0.9 | 0.5 | 0.5 | 0.9 | 0.8 | 0.9 | | 4. Claims on Government | 0.0 | 0.5 | 0.7 | 0.9 | 1.1 | 1.3 | 1.3 | 1.1 | 0.8 | 1.1 | | 5. Insurance Funds | 2.4 | 1.9 | 2.3 | 2.0 | 2.0 | 1.7 | 2.8 | 2.0 | 2.0 | 1.9 | | 6. Provident and Pension Funds | 1.5 | 2.1 | 2.1 | 2.1 | 2.1 | 2.2 | 2.5 | 2.3 | 2.3 | 2.4 | | B. Financial Liabilities | 3.0 | 2.7 | 3.0 | 4.3 | 4.0 | 3.8 | 3.7 | 3.8 | 5.8 | 6.1 | | C. Net Financial Saving (A-B) | 6.9 | 7.9 | 7.3 | 7.5 | 7.8 | 7.6 | 11.6 | 7.2 | 4.9 | 5.1 | GNDI: Gross National Disposable Income.
Note: Figures may not add up to total due to rounding off of numbers.
Source: NSO and RBI staff estimates. | II.2.7 The saving-investment gap narrowed during 2023-24, reflecting a reduced drawdown by the general government, weaker investment demand from households and non-financial corporations, and moderation in savings by financial corporations (Chart II.2.4). 3. Aggregate Supply II.2.8 Aggregate supply – measured by real gross value added (GVA) at basic prices – expanded by 6.4 per cent in 2024-25 as compared with 8.6 per cent a year ago. While industrial activity slowed partly due to an unfavourable base and services sector growth moderated, an improvement in agriculture helped sustain the momentum (Table II.2.3 and Chart II.2.5). Agriculture and Allied Activities II.2.9 Agriculture and allied sectors recovered during 2024-25, supported by an above normal south-west monsoon (SWM). The overall SWM rainfall in 2024 (June-September) was 108 per cent8 of the long-period average (LPA) at the all-India level as against a deficit of six per cent in 2023 (Chart II.2.6a). Its onset over Kerala on May 30 was ahead of the usual date of June 1, and it progressed well to cover the entire country on July 2, six days ahead of the normal date. The SWM rainfall over the monsoon core zone, which consists of most of the rainfed agriculture regions in the country, stood at 122 per cent of LPA. | Table II.2.3: Real GVA Growth | | (Per cent) | | Sector | 2020-21 | 2021-22 | 2022-23 | 2023-24 | 2024-25 | | 1 | 2 | 3 | 4 | 5 | 6 | | I. Agriculture, Forestry and Fishing | 4.0 | 4.6 | 6.3 | 2.7 | 4.6 | | II. Industry | 1.1 | 9.6 | 0.0 | 11.0 | 4.3 | | II.1 Mining and Quarrying | -8.2 | 6.3 | 3.4 | 3.2 | 2.8 | | II.2 Manufacturing | 3.1 | 10.0 | -1.7 | 12.3 | 4.3 | | II.3 Electricity, Gas, Water Supply and Other Utility Services | -4.2 | 10.3 | 10.8 | 8.6 | 6.0 | | III. Services | -7.9 | 10.6 | 10.2 | 9.2 | 7.5 | | III.1 Construction | -4.6 | 19.9 | 9.1 | 10.4 | 8.6 | | III.2 Trade, Hotels, Transport, Communication and Services Related to Broadcasting | -19.9 | 15.2 | 12.3 | 7.5 | 6.4 | | III.3 Financial, Real Estate and Professional Services | 1.9 | 5.7 | 10.8 | 10.3 | 7.2 | | III.4 Public Administration, Defence and Other Services | -7.6 | 7.5 | 6.7 | 8.8 | 8.8 | | IV. GVA at Basic Prices | -4.1 | 9.4 | 7.2 | 8.6 | 6.4 | | Source: NSO and RBI staff estimates. | II.2.10 Above-normal SWM helped replenish reservoir levels to 88 per cent of the capacity by the end of the SWM season from a five-year low of 20 per cent in June 2024 (Chart II.2.6b). II.2.11 Satisfactory progress of SWM and comfortable reservoir levels aided the expansion of the area under foodgrains and oilseeds (kharif and rabi) by 2.7 per cent during the year. Accordingly, the second advance estimates (SAE) of agricultural crops placed foodgrains production during 2024-25 (kharif and rabi) at 3,309.2 lakh tonne, 4.8 per cent higher than the final estimates of 2023-24 (Table II.2.4). The year was marked with the record production of rice, wheat, maize, groundnut and soybean. According to the first advance estimates (FAE), the output of horticultural crops during 2024-25 was placed at 3,620.9 lakh tonne, 2.1 per cent higher than the final estimates (FE) of 2023-24, driven by higher production of onion and potato. II.2.12 The government announced an increase in minimum support prices (MSP) for major kharif and rabi crops for 2024-25 in a range of 1.4 to 12.7 per cent, ensuring a return of at least 50 per cent over the cost of production9. Wheat and paddy MSPs provide 105 per cent and 50 per cent returns over the cost of production, respectively. The Union Budget 2025-26 has focused on areas such as enhancing productivity and sustainability in agriculture and improving agricultural infrastructure. II.2.13 The overall public stock of foodgrains held by the Food Corporation of India (FCI) stood at 749 lakh tonne (as at end-March 2025), with rice stock of 631 lakh tonne (4.6 times the buffer requirement) and wheat stock at 118 lakh tonne (1.6 times the buffer requirement) [Chart II.2.7]. The government relaxed the export restrictions on rice on improved supply conditions while it undertook offloading of wheat under open market sales scheme (OMSS) to moderate wheat prices for consumers. | Table II.2.4: Agricultural Crop Production 2024-25* | | (Lakh tonne) | | Crop | 2023-24 Final Estimates (FE) | 2024-25 Second Advance Estimates (SAE) | 2024-25 (SAE) Variation over 2023-24 Final Estimates (per cent) | | 1 | 2 | 3 | 4 | | 1. Foodgrains | 3,157.7 | 3,309.2 | 4.8 | | Rice | 1,278.6 | 1,364.4 | 6.7 | | Wheat | 1,132.9 | 1,154.3 | 1.9 | | Nutri/Coarse Cereals | 524.5 | 560.3 | 6.8 | | Pulses | 221.7 | 230.2 | 3.8 | | Tur | 34.2 | 35.1 | 2.8 | | Gram | 110.4 | 115.4 | 4.5 | | Urad | 20.9 | 18.0 | -14.0 | | Moong | 12.6 | 16.1 | 28.0 | | 2. Oilseeds | 384.4 | 416.7 | 8.4 | | 3. Cotton# | 325.2 | 294.3 | -9.5 | | 4. Jute and Mesta## | 96.9 | 86.2 | -11.0 | | 5. Sugarcane | 4,531.6 | 4,350.8 | -4.0 | *: Kharif and Rabi crops (excluding summer crops). #: Lakh bales of 170 kg each. ##: Lakh bales of 180 kg each.
Source: Ministry of Agriculture and Farmers Welfare, GoI. |
Industrial Sector II.2.14 Industrial sector GVA growth eased to 4.3 per cent in 2024-25 from 11.0 per cent in the preceding year (Table II.2.3). Manufacturing sector, which accounts for 80 per cent of the industrial sector also moderated to 4.3 per cent in 2024-25 over a high base of 12.3 per cent in 2023-24. This was mirrored in a slowdown of profitability in the corporate manufacturing sector (Chart II.2.8). II.2.15 Industrial output, as measured by the index of industrial production (IIP), moderated during 2024-25 (Chart II.2.9a). Within the manufacturing sector, 17 of 23 industry groups recorded expansion (y-o-y). As per the use-based classification, all categories of industries except consumer non-durables recorded growth (Chart II.2.9b). II.2.16 The production linked incentive (PLI) scheme is helping to steer growth across several key manufacturing industries and placing the country as a part of the global value chain through production and exports. By end-November 2024, actual investments of around ₹1.61 lakh crore have been realised, resulting in production and sales of around ₹14 lakh crore, over 11.5 lakh jobs (direct and indirect) and more than ₹5.3 lakh crore of exports in key sectors such as electronics, pharmaceuticals, and food processing10. The government has launched the second edition of the PLI scheme for specialty steel in January 202511. 
 II.2.17 Renewable energy (including large hydro), which accounts for around 20.0 per cent of the total power generation, recorded a healthy growth of 12.2 per cent (y-o-y) during 2024-25 as compared to a contraction of 1.6 per cent in the previous year (Chart II.2.10). As at end-March 2025, India’s renewable energy capacity stood at 220.1 gigawatts (GW) [46.3 per cent of the total installed capacity]. Services Sector II.2.18 Growth in the services sector softened in H1:2024-25 due to a broad-based moderation across its constituents. Proximate indicators of the services sector, such as GST E-way bills, commercial vehicle sales, aviation cargo and passenger traffic have remained firm in H2 (Table II.2.5). II.2.19 India’s construction sector exhibited a mixed picture as steel consumption slowed while cement production recovered during H2. Housing sales, after registering an uptick in 2023-24, slowed in 2024-25 with growth turning negative in the last three quarters. Launches continued to decline for the sixth quarter on a y-o-y basis (Chart II.2.11).
II.2.20 The services sector composite index (SSCI)12, which monitors activity in construction, trade, transport, and financial services, and serves as a coincident indicator of GVA growth in the services sector [excluding public administration, defence, and other services (PADO)], rebounded in Q3:2024-25 after observing a sequential decline in the previous two quarters. The recovery in Q3 was on account of a turnaround in trade and construction sector indicators. SSCI remained robust in Q4:2024-25 (Chart II.2.12). 4. Employment II.2.21 According to the latest periodic labour force survey (PLFS) report, the labour force participation rate (LFPR) and worker population ratio (WPR) increased during 2023-24 (July-June), marking their highest levels since its inception. The unemployment rate (UR) remained unchanged in 2023-24 from the previous year (Chart II.2.13a). The overall LFPR increased in both rural and urban areas in 2023-24, driven by a rise in the female LFPR (Chart II.2.13b). Similar patterns were witnessed in the case of WPR. The unemployment rate declined in urban regions, while it increased marginally in rural regions. The proportion of self-employed in the workforce has been increasing consistently since 2018-19 while the share of casual labourers is on the decline. The share of regular wage/salaried employees improved to 21.7 per cent in 2023-24 from 20.9 per cent in 2022-23, although it was lower than 23.8 per cent recorded in 2018-19 (Chart II.2.13c).  II.2.22 As per the quarterly PLFS covering urban areas, the LFPR and the worker population ratio for persons aged 15 years and above remained steady during Q3:2024-25, with unemployment rate hovering at the lowest of the series (Chart II.2.14). The employment in the organised sector, as measured by payroll data, also remained robust in 2024-25 (Chart II.2.15). The average net subscribers added to employees’ provident fund organisation (EPFO) per month stood at 10.8 lakh during 2024-25, reflecting continued strength in formal sector employment opportunities. II.2.23 The employment index in the purchasing managers’ index (PMI) remained above the ‘no change’ level of 50 for the manufacturing and services sector throughout 2024-25 (Chart II.2.16a). The Naukri index, which provides information on job listings, showed an uptick in white-collar hiring in 2024-25 (Chart II.2.16b).
II.2.24 Research and development (R&D) expenditure fosters innovation and technological progress and is associated with improved firm and overall productivity. In India, the ratio of R&D expenditure in GDP rose marginally from 0.61 per cent to 0.64 per cent13 between 1995-96 and 2020-21. India’s share in global R&D expenditure rose from 2.1 per cent in 2000 to 2.6 per cent in 2023 (World Intellectual Property Organisation, 2024) [Box II.2.1]. Box II.2.1 R&D Expenditure as a Driver of India’s Productivity Growth Impact of R&D investment on total factor productivity (TFP) is well established through specific sectors and firm size, with large firms and high-tech industries gaining more (Griliches,1998). Recent country-specific studies (Mamatzakis et al., 2023; Ali and Akhtar, 2024) as well as panel studies on emerging market economies (EMEs) [Herzer, 2022] also corroborate the positive impact of R&D investment on TFP. The available literature suggests that the effect is more pronounced for advanced economies owing to their higher absorptive capacity and supportive institutional frameworks (OECD, 2015); foreign R&D spillovers via imports or foreign direct investment (FDI) which often outweigh the impact of domestic R&D (Krammer, 2015). The effect of domestic R&D on TFP growth followed an inverted-U pattern, suggesting that middle-income countries benefit the most from domestic R&D as compared to low-and high-income countries (Goñi and Maloney, 2014). In case of India, productivity gains of high-tech firms in the manufacturing sector are found to be associated with higher R&D intensity in the previous period along with FDI flows in the sector and higher usage of imported inputs and capital goods (Bhattacharya et al., 2021). Cross-country data suggest that R&D expenditure is generally positively associated with TFP growth (Chart 1a). Countries with higher income levels, as measured by GDP per capita, tend to have better innovation rankings. India secured 39th position among 133 economies in the Global Innovation Index 2024 (Chart 1b). 
| Table 1: Impact of R&D Expenditure Growth on TFP Growth in India | | Dependent Variable: India’s Aggregate TFP Growth | | 1 | 2 | 3 | 4 | 5 | | Model 1 | Model 2 | Model 3 | Model 4 | | Gross R&D Expenditure | 0.24** | 0.24*** | 0.26*** | 0.21*** | | | (0.12) | (0.088) | (0.055) | (0.077) | | FDI Inflows | | | 0.0029* | 0.0035** | | | | | (0.0017) | (0.0018) | | Export + Import | | | | 0.062*** | | | | | | (0.024) | | Deterministic Trend | -0.00016 | 0.021 | 0.15*** | 0.19*** | | | (0.046) | (0.052) | (0.034) | (0.027) | | Global Metal Price Indext-2 | | -0.016 | -0.045** | -0.030 | | | | (0.019) | (0.019) | (0.022) | | Annual Rainfall’s Deviation from LPAt-2 | | 0.030 | 0.062*** | 0.12*** | | | | (0.028) | (0.024) | (0.034) | | Constant | -0.43 | -0.53 | -3.28*** | -4.14*** | | | (1.12) | (0.72) | (1.06) | (1.00) | | Number of Observations | 34 | 34 | 29 | 29 | | Wald Chi-Square | 10.1 | 40.8 | 45.9 | 71.5 | | Wald Chi-Square: p-value | 0.017 | 0.00 | 0.00 | 0.00 | | Hansen’s J Chi-Square | 1.37 | 12.3 | 11.9 | 10.3 | | Hansen’s J Chi-Square p-value | 0.50 | 0.09 | 0.16 | 0.17 | | GMM C (Orthogonality) Chi-Square | 0.86 | 0.059 | 0.29 | 2.68 | | GMM C (Orthogonality) Chi-Square: p-value | 0.35 | 0.80 | 0.87 | 0.44 | ***, ** and * indicate significance levels at 1 per cent, 5 per cent and 10 per cent, respectively.
Note: 1. Figures in parentheses are robust standard errors.
2. Hansen’s J-test suggests that the overidentifying restrictions are valid at 5 per cent.
3. The GMM C tests fail to reject the null hypothesis that the explanatory variables are exogenous at 5 per cent.
4. The Annual estimates for R&D expenditure are available from 1995-96 onwards only. Additional estimates for 1985-86 and 1990-91 were available at the source. The R&D expenditure for the intermediate years between 1985-86 and 1990-91, and 1990-91 and 1995-96 are interpolated.
5. TFP growth, gross R&D expenditure, FDI inflows, export and import, and global metal price index have been used in terms of y-o-y growth. | In this study, the impact of growth in India’s aggregate R&D expenditure on aggregate TFP growth is explored in a generalised method of moments (GMM) framework for the period 1986-87 to 2019-20 (Table 1). The GMM methodology was preferred to control for inherent endogeneity, as R&D investments may also be affected by the level of output, profits, and productivity. Accordingly, appropriate instruments are used for R&D investments like growth, economic disturbances, commodity prices, etc. The models suggest that a one percentage point increase in R&D expenditure leads to a 0.21 to 0.26 percentage point rise in TFP growth. Some of the control variables such as FDI and trade flows were found to positively and significantly impact TFP. In contrast, some supply side factors such as increase in global metal price and adverse monsoons have a negative impact on TFP growth. The above evidence substantiates the criticality of R&D investment for sustaining innovation and long-term productivity growth. Apart from the direct impact, incentivising R&D could have a significant spillover effect on the wider economy. References: 1. Ali, L., and Akhtar, N. (2024), ‘The Effectiveness of Export, FDI, Human Capital, and R&D on Total Factor Productivity Growth: The Case of Pakistan’, Journal of the Knowledge Economy, 15(1), 3085-3099. 2. Bhattacharya, M., Okafor, L. E., and Pradeep, V. (2021), ‘International Firm Activities, R&D, and Productivity: Evidence from Indian Manufacturing Firms’, Economic Modelling, 97, 1-13. 3. Goñi, E. and Maloney, W. F. (2014), ‘Why Don’t Poor Countries Do R&D?’, Policy Research Working Paper Series 6811, The World Bank, Washington D.C. 4. Griliches, Z. (1998), ‘R&D and Productivity: The Econometric Evidence’, University of Chicago Press, Chicago. 5. Herzer, D. (2022), ‘The Impact of Domestic and Foreign R&D on TFP in Developing Countries’, World Development, 151, 105754. 6. Krammer, S. M.S. (2015), ‘Do Good Institutions Enhance the Effect of Technological Spillovers on Productivity? Comparative Evidence from Developed and Transition Economies’, Technological Forecasting and Social Change, 94(C), 133-154. 7. Mamatzakis, E., Pegkas, P., Staikouras, C., and Tsamadias, C. (2023), ‘R&D Contribution in TFP Growth of Greek industry: A Limited Information Likelihood Approach’, Bulletin of Economic Research, 75(4), 1086-1111. 8. OECD (2015), ‘The Future of Productivity’, Organisation for Economic Co-operation and Development, Paris. | 5. Conclusion II.2.25 India’s economic activity gained momentum in H2:2024-25 driven by an uptick in domestic demand, increase in exports of goods and services, buoyant agriculture sector and sustained resilience in services. Rising input cost pressures in the manufacturing sector coupled with global headwinds such as protectionist trade policies, persistent geopolitical tensions and subdued global demand, however, continue to pose risks to growth. II.3 PRICE SITUATION II.3.1 In India, headline inflation14 moderated to an average of 4.6 per cent during 2024-25 from 5.4 per cent during 2023-24, with intra-year trajectory driven by food price fluctuations due to recurrent supply-side shocks from weather disturbances. Consumer Price Index (CPI) inflation eased during April-August 2024 followed by hardening in September-October due to a sharp increase in food prices, driven mainly by vegetables and edible oils. Subsequently, food inflation eased during November 2024-March 2025 with the winter crop arrivals. Fuel prices remained in deflation led by a fall in liquefied petroleum gas (LPG) prices. Core inflation (i.e., CPI excluding food and fuel) eased during 2024-25, reflecting, inter alia, the cumulative and lagged impact of monetary policy actions and easing of input cost pressures (Chart II.3.1). Proactive supply management measures by the government also aided in containing inflationary pressures in 2024-25. II.3.2 Volatility of headline inflation, as measured by standard deviation, remained unchanged in 2024-25 (Table II.3.1). The intra-year distribution of inflation showed a negative kurtosis reflecting fewer extreme values in 2024-25. II.3.3 Against this backdrop, sub-section 2 assesses developments in global commodity prices and inflation. Sub-section 3 discusses movements in headline inflation in India including major turning points, followed by a detailed analysis of its primary constituents in sub-section 4. Other indicators of prices and costs are analysed in sub-section 5, followed by the concluding observations. | Table II.3.1: CPI Headline Inflation – Key Summary Statistics | | (Per cent) | | | 2015-16 | 2016-17 | 2017-18 | 2018-19 | 2019-20 | 2020-21 | 2021-22 | 2022-23 | 2023-24 | 2024-25 | | 1 | 2 | 3 | 4 | 5 | 6 | 7 | 8 | 9 | 10 | 11 | | Mean | 4.9 | 4.5 | 3.6 | 3.4 | 4.8 | 6.2 | 5.5 | 6.7 | 5.4 | 4.6 | | Standard Deviation | 0.7 | 1.0 | 1.2 | 1.1 | 1.8 | 1.1 | 0.9 | 0.7 | 0.9 | 0.9 | | Skewness | -0.9 | 0.2 | -0.2 | 0.1 | 0.5 | -0.7 | -0.1 | -0.1 | 1.5 | 0.0 | | Kurtosis | -0.1 | -1.6 | -1.0 | -1.5 | -1.4 | -0.7 | -1.0 | -0.6 | 1.6 | -1.2 | | Median | 5.0 | 4.3 | 3.4 | 3.5 | 4.3 | 6.5 | 5.6 | 6.7 | 5.1 | 4.8 | | Maximum | 5.7 | 6.1 | 5.2 | 4.9 | 7.6 | 7.6 | 7.0 | 7.8 | 7.4 | 6.2 | | Minimum | 3.7 | 3.2 | 1.5 | 2.0 | 3.0 | 4.1 | 4.2 | 5.7 | 4.3 | 3.3 | Note: Skewness and Kurtosis are unit-free. Annual inflation is the average of the monthly inflation rates during the year and therefore, may vary from the annual inflation calculated from the average index for the year.
Source: NSO and RBI staff estimates. | 2. Global Inflation Developments II.3.4 Global commodity prices moderated in 2024 on the back of subdued demand and improved supply conditions (Chart II.3.2). While food prices corrected in 2024 on robust agricultural production and higher supplies, beverages witnessed sharp price pressures – driven primarily by cocoa and coffee prices on weather-induced supply disturbances. In the second half of 2024, palm oil prices also increased sharply, inter alia, on Indonesia’s announcement of the B40 bio-diesel programme in August 2024 mandating higher palm oil blending with diesel (up from 35 per cent to 40 per cent), effective from January 1, 2025. Energy prices fell further in 2024 as increased oil supply by non-OPEC offset supply cuts by OPEC+amid subdued consumption demand. Metals and minerals prices, however, increased in 2024 with increase in copper and aluminium demand from renewable energy sources, electricity grids and electric vehicles. Prices of precious metals such as gold and silver increased on rising global demand for safe haven assets. 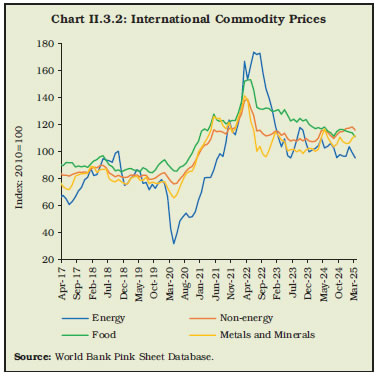 3. Inflation in India II.3.5 CPI headline inflation in India eased from 4.8 per cent in April-May 2024 to 3.6 per cent in July 2024 before rising again to 6.2 per cent in October 2024 (Chart II.3.3). The movements in headline inflation were driven primarily by the food group due to overlapping supply shocks from intermittent weather disturbances, even as core inflation remained largely contained while fuel continued to be in deflation. Headline inflation eased to 3.3 per cent in March 2025 on sharp moderation in food inflation. Overall, headline inflation averaged 4.6 per cent during 2024-25, 73 basis points (bps) lower than the previous year (Appendix Table 4). 
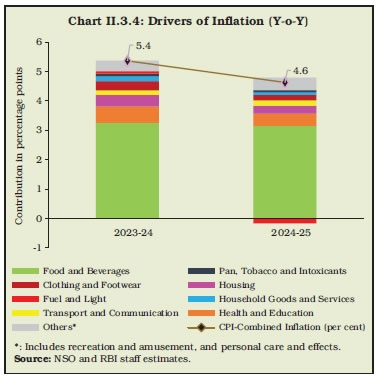 II.3.6 Inflation in food and beverages averaged 6.7 per cent and contributed 68 per cent to headline inflation during 2024-25 as compared with 61 per cent a year ago (Chart II.3.4). Weather disturbances such as heatwave conditions and uneven rainfall distribution affected agricultural crops, disrupting the domestic availability and supply chains. While tight supply conditions in wheat and pulses impacted domestic availability, uptick in global edible oil prices led to a substantial pick-up in imported inflation. Consequently, food inflation remained firm, with vegetables, cereals, pulses and edible oil prices being the key drivers. II.3.7 Apart from recurrent supply shocks, the changing consumption pattern of households also weigh on the dynamics of food inflation (Box II.3.1). Box II.3.1 Food Inflation Persistence and Shifting Household Consumption Pattern Amidst continuing pressures from food inflation on account of overlapping supply shocks, persistence in food inflation and its components is estimated for a 48-month rolling window using an AR(1) process. where πi,t refers to the demeaned monthly momentum (based on seasonally adjusted CPI) of the ith item at time t, ρi is the persistence parameter, and εi,t is the error term. The results show that the persistence in food prices, which had moderated post the introduction of flexible inflation targeting (FIT), picked up in the post-COVID period, yet remaining lower than the pre-FIT period (Chart 1a). A disaggregated analysis indicates that this increase is primarily driven by cereals, egg, meat and fish, fruits, milk, oils and fats, spices, and processed food and beverages (Chart 1b). On the other hand, inflation persistence is estimated to have ebbed in vegetables, sugar and pulses. Apart from intermittent supply shocks, demand side factors can also impart stickiness to food prices. The evolving demand conditions have been analysed using the 2011-12 and 2022-23 rounds of the household consumption expenditure survey (HCES). The estimated per capita real expenditure across 12 fractiles (as defined by the HCES) shows an upward shift in both rural and urban sectors (Chart 2). A mapping of changes in expenditure shares with persistence reveals that food sub-groups that saw an increase in expenditure on animal proteins (i.e., egg, meat, fish, and milk), fruits, oils and fats, and processed food and beverages, have also become more persistent in recent years (Table 1). Moreover, the shift in expenditure towards fruits, egg, meat and fish, milk, and oils and fats are the largest across lower fractile households, while increased expenditure on processed food and beverages is greater among higher fractile groups. Cereals, however, show a diverging trend – a rise in persistence despite a fall in expenditure shares indicating the dominance of supply side factors. Overall, the overlapping supply shocks coupled with the evolving demand dynamics for food products, driven by change in dietary habits, underscore the need for careful monitoring of food inflation. 
| Table 1: Change in Expenditure Shares and Persistence | | Food Sub-group | Weight in CPI-Food and Beverages (per cent) | Change in Expenditure Shares in Food Group by Expenditure Fractiles (per cent) | Change in Persistence Parameter | | 0-40 | 40-50 | 50-100 | All Classes | | 1 | 2 | 3 | 4 | 5 | 6 | 7 | | Cereals | 9.7 | -13.24 | -9.67 | -6.00 | -8.35 | 0.16 | | Pulses | 2.4 | -1.20 | -1.27 | -1.14 | -1.19 | -0.11 | | Vegetables | 6.0 | -1.30 | -1.20 | -0.85 | -1.01 | -0.42 | | Fruits | 2.9 | 3.18 | 3.04 | 1.60 | 2.25 | 0.07 | | Egg, Meat and Fish | 4.0 | 2.78 | 1.71 | 0.39 | 1.13 | 0.03 | | Milk | 6.6 | 4.98 | 3.42 | 1.10 | 2.45 | 0.11 | | Spices | 2.5 | -0.35 | -0.42 | -0.20 | -0.29 | 0.08 | | Oils and Fats | 3.6 | 1.17 | 0.30 | -0.02 | 0.32 | 0.50 | | Sugar | 1.4 | -1.19 | -1.33 | -1.24 | -1.24 | -0.02 | | Processed Food and Beverages | 5.6 | 5.17 | 5.42 | 6.35 | 5.93 | 0.28 | Note: 1. Change in expenditure share is derived as variation in 2022-23 over 2011-12.
2. Change in persistence is derived as variation in persistence parameter between 2021-24 and 2016-19.
3. Expenditure fractiles: 0-40 per cent, 40-50 per cent, 50-100 per cent, and all classes are aggregated from the HCES, and the values depict changes in expenditure shares of food items for the respective expenditure groups.
Source: MoSPI and RBI staff estimates. | References: 1. Bilke, L. and Stracca L. (2007), ‘A Persistence-weighted Measure of Core Inflation in the Euro Area’, Economic Modeling, 24(6). 2. Patra, M. D., Khundrakpam, J. K., and George, A. T. (2014), ‘Post-global Crisis Inflation Dynamics in India: What has Changed?’, India Policy Forum 2013-14, Vol. 10, National Council of Applied Economic Research (NCAER), New Delhi. 3. Blinder, A. (1997), ‘Measuring Short-run Inflation for Central Bankers: A Commentary’, Federal Reserve Bank of Saint Louis Review, May/June 1997, 79(3). 4. Mittal, S. (2006), ‘Structural Shift in Demand for Food: Projections for 2020’, Working Paper No.184, August, Indian Council for Research on International Economic Relations (ICRIER), New Delhi. | II.3.8 Inflation in fuel and light averaged (-) 2.5 per cent during 2024-25, significantly lower than 1.2 per cent a year ago. The deflation was driven by reduction in domestic prices of LPG and kerosene during 2023 and 2024 in the wake of a correction in global energy prices. Electricity prices, however, increased by 6.4 per cent during 2024-25 due to tariff hikes in some states. II.3.9 Inflation excluding food and fuel, or core inflation, eased to 3.5 per cent during 2024-25 from 4.3 per cent a year ago, driven mainly by clothing and footwear, housing, household goods and services, health, and education. Inflation in transport and communication and personal care and effects, however, were higher due to hikes in mobile tariffs by major telecom service providers and international price pressures in gold and silver, respectively. 4. Constituents of CPI Inflation Food II.3.10 Food and beverages inflation averaged 7.4 per cent in April 2024-January 2025 as compared to 6.9 per cent in the corresponding period of 2023-24. However, sharp correction in vegetable prices in February-March 2025 led to a moderation in food inflation to 6.7 per cent in 2024-25 as compared to 7.0 per cent in 2023-24. Within the food group, inflation increased in four sub-groups while it moderated for the remaining eight sub-groups as compared with last year (Charts II.3.5 and II.3.6).  II.3.11 Vegetables (weight: 13.2 per cent in the food and beverages group) inflation remained volatile and elevated at 19.4 per cent in 2024-25, keeping overall food inflation firm. Vegetable prices rose during April-July 2024 on the back of supply disturbances from heatwave conditions in northern India and excess rains in southern and central parts of the country. Prices, after softening in August, driven by sharp correction in tomato prices, hardened again in September-October on account of weather disturbances and festive demand. Prices corrected sharply during November 2024-March 2025 by around (-) 38 per cent with increase in market arrivals, reflecting higher production in 2024-25 [3.6 per cent as per first advance estimates (1st AE) over 2023-24] (Charts II.3.7a and II.3.7b). 
 II.3.12 Among key vegetables, potato inflation remained elevated and averaged 54.1 per cent during 2024-25 on account of a production shortfall in 2023-24 [(-) 5.0 per cent over 2022-23] due to high minimum temperatures during winter and prolonged fog conditions in major producing states. However, with increase in production in 2024-25 (4.4 per cent as per 1st AE over 2023-24) and higher market arrivals, potato inflation moderated during January-March 2025. Onion price inflation averaged 52.3 per cent during April-October 2024 due to a steep fall in production in 2023-24 [(-) 19.5 per cent over 2022-23]. In order to contain price pressures, the government procured 4.7 lakh metric tonnes (MT) of rabi onion for open market sales at a subsidised rate of ₹35 per kg across major consumption centres in September 2024 and started a special train in October, ‘Kanda Express’, for faster distribution from surplus states to deficit states. Further, the government allowed export of onions subject to a 40 per cent export duty and a minimum export price (MEP) of US$ 550 per metric tonne (MT) in May 2024 which was withdrawn subsequently; and the export duty was lowered to 20 per cent in September 2024. However, higher production in 2024-25 (18.9 per cent as per 1st AE over 2023-24) and robust market arrivals led to correction in onion prices during December 2024-March 2025. Tomato prices exhibited significant volatility in 2024-25, recording an average inflation (y-o-y) of 36.6 per cent between April-June 2024, before recording deflation of 43 per cent in July due to favourable base effects, which deepened to 47.9 per cent in August 2024 due to sharp price corrections on fresh crop arrivals. However, inflation in tomato prices increased to 161 per cent in October on lower mandi arrivals due to crop damage from high temperatures and rainfall in southern states. This was followed by a sharp price correction as supply improved during January-March 2025 leading to a deflation of (-) 35.0 per cent in March 2025. Vegetables excluding TOP (tomato, onion, and potato), particularly garlic, also witnessed high price pressures due to excess rain-induced damages which, however, corrected sharply during November 2024-March 2025 with improvement in domestic supply. Overall, vegetables witnessed the highest winter price correction in the current series of CPI (November-February), which extended to March 2025 on higher mandi arrivals and conducive weather conditions. II.3.13 Inflation in cereals and products (weight of 21 per cent in the CPI-food and beverages) remained firm at 7.2 per cent during 2024-25, albeit lower than 10.7 per cent in the previous year. Within cereals, inflation in rice prices, after remaining in double-digits for 22 months, moderated to 9.6 per cent in August 2024 and further to 4.9 per cent in March 2025. The correction was largely on account of higher production in 2024-25 (6.7 per cent as per 2nd AE over 2023-24) as well as supply management measures by the government such as retail sale of ‘Bharat Rice’ and provisioning for rice-deficient states to directly purchase from the Food Corporation of India (FCI) at a fixed price of ₹2,250 per quintal under the open market sale scheme (OMSS) from August 2024. With easing supply conditions, the government removed the MEP of US$ 950 per MT on basmati rice, lifted the ban on exports of non-basmati white rice in September 2024, removed its MEP clause in October 2024, and revoked the ban on broken rice in March 2025, to encourage higher exports. Inflation in wheat prices, on the other hand, increased from 6.0 per cent in April 2024 to 9.0 per cent in March 2025, even as production was higher (2.5 per cent in 2023-24 over 2022-23). The government undertook price stabilisation measures, including imposition of stock limits for traders and wholesalers (till March 2025), sale of 2.5 million tonnes of wheat through e-auctions under OMSS till March 2025 [at a reserve price of ₹2,325 per quintal for fair and average quality (FAQ) grain and ₹2,300 per quintal for under reduced specifications (URS) grain], and continued restrictions on wheat exports. Wheat buffer stocks remained at 1.6 times the norm as of April 1, 2025. Higher rabi production of wheat in 2024-25 (1.9 per cent as per 2nd AE over 2023-24) augurs well for the wheat prices going forward. II.3.14 Animal protein items such as eggs, meat and fish (weight of 8.8 per cent in CPI-food and beverages) witnessed seasonal uptick in prices during April-June 2024 due to heatwaves which impacted the production of poultry in major producing states of southern India (Chart II.3.8a). Prices moderated subsequently due to the seasonal fall in demand during July-August 2024 on account of Shravana period. However, price pressures re-emerged in September-October 2024, particularly in case of eggs reflecting pick-up in seasonal demand. Driven by reduced demand due to bird flu in some states, prices for eggs, meat and fish, softened during February-March 2025. Inflation in prices of milk and products was range bound at 2.9 per cent during 2024-25, benefitting from stable prices of feed and adequate milk supply (Chart II.3.8b). II.3.15 Prices of oils and fats (weight of 7.8 per cent in CPI-food and beverages) continued in deflation during April-August 2024 averaging (-) 4.2 per cent; inflation turned positive in September and reached 17.1 per cent in March 2025. The turnaround in prices after a gap of 19 months was due to increase in international edible oil prices and import duty hike of 20 percentage points on crude and refined edible oils, effective from September 2024 (Chart II.3.9). Ghee and butter price inflation, however, continued to moderate in tandem with declining milk prices.  II.3.16 Inflation in prices of pulses (weight of 5.2 per cent in CPI-food and beverages) moderated from May 2024 and recorded (-) 2.7 per cent in March 2025 (Chart II.3.10). Higher production of key pulses such as tur (2.8 per cent), moong (28 per cent) and gram (4.5 per cent) as per 2nd AE of 2024-25 over 2023-24, and supply management measures, including continued free imports of yellow peas till May 31, 2025, tur and urad till March 31, 2026, weekly stock disclosure requirements for major pulses, and sale of chana, moong and masur dal under the brand ‘Bharat Dal’, contributed to the moderation in pulses price inflation. 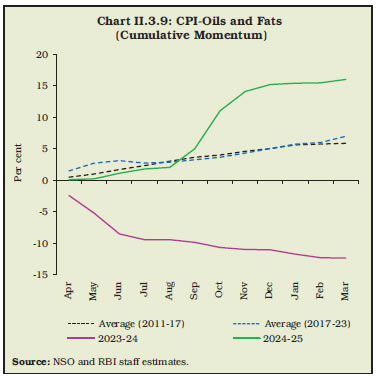
 II.3.17 Inflation in fruits (weight of 6.3 per cent in CPI-food and beverages) averaged 6.3 per cent during April-June 2024 on account of lower mandi arrivals of major fruits including banana, mango and coconut. Prices corrected in July on favourable base effects. However, inflation increased to 10.2 per cent during August 2024-March 2025 despite adequate production (0.2 per cent higher as per 1st AE 2024-25 over 2023-24), primarily driven by a sharp increase in coconut prices. II.3.18 Among other food items, inflation in prices of spices corrected to an average of (-) 3.3 per cent during 2024-25 as against 18.9 per cent a year ago, driven primarily by fall in prices of jeera (cumin) and dry chillies, on account of higher production of spices in 2023-24 (5.5 per cent over 2022-23). Inflation in sugar and confectionery prices was subdued in 2024-25 despite a shortfall in production [(-) 4.0 per cent as per 2nd AE 2024-25 over 2023-24]. Restrictions previously imposed on sugar diversion for ethanol production were, however, eased in August 2024. Inflation in prepared meals also remained subdued and averaged 3.8 per cent during 2024-25. Fuel II.3.19 Fuel and light (weight of 6.8 per cent in CPI) prices remained in deflation during 2024-25, averaging (-) 2.5 per cent (Chart II.3.11). After remaining in deflation during April 2024-February 2025, fuel inflation increased to 1.5 per cent in March 2025. The domestic LPG price cut of ₹100 per cylinder in March 2024 accentuated the pace of deflation in fuel observed in 2024-25 (Chart II.3.12). Consequently, the contribution of the fuel group to headline inflation decreased to (-) 3.6 per cent in 2024-25 from 1.6 per cent a year ago. Core Inflation (Inflation Excluding Food and Fuel) II.3.20 Inflation excluding the food and fuel groups, i.e., core inflation, moderated to an average of 3.5 per cent during 2024-25 from 4.3 per cent a year ago (Appendix Table 4). After touching 3.1 per cent during May-June 2024 – the lowest in the current series – it picked up in the subsequent months to reach 4.1 per cent in March led by hike in mobile tariffs and hardening of gold and silver prices (Chart II.3.13). 
 II.3.21 Among the major constituents, inflation in clothing and footwear fell to 2.7 per cent during 2024-25 from 4.7 per cent a year ago, reflecting lower domestic and international cotton prices and subdued export demand of textiles and wearing apparel. Household goods and services, health, and education also witnessed moderate price pressures during 2024-25. Inflation in transport and communication rose marginally to 2.4 per cent in 2024-25 from 1.9 per cent a year ago, driven by the increase in mobile tariffs in July-August 2024. After a cut in domestic retail prices of petrol and diesel in March-April 2024, they remained unchanged during the year (Chart II.3.14). The pick-up in inflation in transport and communications from 1 per cent during May-June 2024 to 2.8 per cent during July 2024-March 2025 contributed to the rise in core inflation. Around 78 per cent of the core CPI items registered less than 4 per cent inflation during 2024-25 as compared to 51 per cent in the previous year (Chart II.3.15). II.3.22 Housing inflation fell from 3.9 per cent during 2023-24 to 2.8 per cent during 2024-25 due to subdued house rent inflation. Inflation in personal care and effects rose to 9.8 per cent during 2024-25 from 7.8 per cent a year ago, primarily driven by higher international prices of gold on global safe haven demand amidst geopolitical uncertainty and the evolving global monetary policy trajectory. 5. Other Indicators of Inflation II.3.23 From a sectoral perspective, inflation measured by the CPI for industrial workers (CPI-IW) moderated to 3.4 per cent during 2024-25 from 5.2 per cent a year ago, driven by lower fuel and core inflation. Inflation based on the CPI for agricultural labourers (CPI-AL) and rural labourers (CPI-RL) moderated to 5.7 per cent, each, during 2024-25 from 7.1 per cent and 6.9 per cent, respectively, a year ago, primarily driven by moderation in food inflation. II.3.24 Inflation measured by the wholesale price index (WPI) increased to 2.3 per cent during 2024-25 from a deflation of (-) 0.7 per cent a year ago, primarily due to an uptick in food inflation and pass-through of global metals and minerals prices. WPI inflation in primary articles (weight of 22.6 per cent in the WPI basket) increased to 5.1 per cent during 2024-25 from 3.5 per cent a year ago, driven by food price pressures due to weather disturbances. In contrast, fuel and power recorded deflation, averaging (-) 1.3 per cent during 2024-25, mirroring the easing of global energy prices. Inflation in manufactured products (weight of 64.2 per cent) increased to 1.7 per cent during 2024-25 from a deflation of (-) 1.7 per cent a year ago, led by food products, and non-ferrous and precious metals. Reflecting the increase in WPI inflation, the gross domestic product (GDP) deflator inflation increased to 3.0 per cent during April-December 2024 from 2.3 per cent in the corresponding period of the previous year. II.3.25 Minimum support prices (MSPs) in 2024-25 were increased in the range of 1.5-12.7 per cent for the kharif crops and 2.4-7.0 per cent for the rabi crops. Nigerseed witnessed the maximum MSP increase among the kharif crops while barley recorded the highest increase among the rabi crops. II.3.26 Nominal rural wage growth decelerated marginally to 5.9 per cent during 2024-25 from 6.0 per cent during the previous year, primarily driven by non-agricultural wages, which moderated to 5.6 per cent during 2024-25 from 5.9 per cent a year ago. The moderation was driven by handicraft workers, bamboo/cane basket weavers, and sweeping/cleaning workers within the category of non-agricultural labourers. Agricultural wages, however, increased marginally to 6.3 per cent during 2024-25 from 6.0 per cent a year ago. 6. Conclusion II.3.27 Headline inflation moderated in 2024-25 on account of robust agricultural crop production, softening global commodity prices - particularly food and energy, easing supply chain pressures, supply management measures undertaken by the government and lagged impact of monetary policy actions. Food inflation, which remained elevated on recurrent weather-induced supply disturbances, corrected in January-March 2025 on higher market arrivals. Fuel prices remained in deflation in 2024-25 on lower prices of LPG and kerosene. Core inflation softened to its lowest in the current series during the initial part of the year, with benign uptick in the subsequent months. Looking ahead, food inflation is likely to soften on the back of a better rabi crop leading to gradual moderation in headline inflation. The disinflationary process, however, is subject to uncertainties emanating from prolonged geopolitical conflicts, evolving trade dynamics and weather conditions, which warrant continuous vigil and careful monitoring of the evolving dynamics. II.4 MONEY AND CREDIT II.4.1 Monetary and credit conditions evolved in sync with the monetary policy stance during the year. Reserve money (RM) adjusted for the first-round impact of changes in the cash reserve ratio (CRR)15 moderated during the year on account of deceleration in bankers’ deposits with the Reserve Bank; while currency in circulation (CiC) expanded at a higher pace in comparison with the previous year as the impact of withdrawal of ₹2000 banknotes from circulation initiated in May 2023 dissipated. Bank credit growth remained in double digits, even as the wedge between deposit and credit growth moderated. II.4.2 Against this backdrop, sub-section 2 delves into reserve money dynamics and the shifts in the Reserve Bank’s balance sheet. Sub-sections 3 and 4 examine developments in money supply and bank credit, respectively, followed by concluding observations. 2. Reserve Money16 II.4.3 Reserve money (RM) represents the stock of monetary liabilities in the central bank’s balance sheet (Chart II.4.1). Risk buffers and revaluation accounts [forming the bulk of net non-monetary liabilities (NNML)] along with surplus liquidity placed by banks with the Reserve Bank under the reverse repos/standing deposit facility (SDF) are the other major components of the balance sheet. II.4.4 The Reserve Bank’s balance sheet size moderated to 22.8 per cent of GDP as at end-March 2025 from 23.5 per cent as at end-March 2024, mirroring the trend observed in other major economies (Chart II.4.2). II.4.5 The RM17 growth, adjusted for the first-round impact of change in CRR, stood at 5.8 per cent in 2024-25 as compared with 6.7 per cent a year ago (Chart II.4.3a and Appendix Table 4). RM growth witnessed a transient slump in August 2024 due to the base effect of temporary imposition of incremental CRR (I-CRR)18 in August 2023 (Chart II.4.3b). II.4.6 The growth in CiC - the major constituent of RM with a share of 76.9 per cent – recovered to 5.8 per cent during 2024-25 from 4.1 per cent a year ago, reflecting the impact of withdrawal of ₹2000 banknotes, as noted earlier19 (Charts II.4.3a and II.4.3c). Growth in bankers’ deposits with the Reserve Bank (20.8 per cent share in RM), i.e., balances maintained by banks to meet their CRR requirements, declined by 6.5 per cent during the year, reflecting the reduction in CRR by 50 bps and moderation in bank deposits (Chart II.4.3a). Adjusted for the first-round impact of the CRR reduction, bankers’ deposits rose by 4.4 per cent. II.4.7 The currency-GDP ratio moderated further with the increasing usage of digital payments, including central bank digital currency (CBDC)20. Retail digital payments increased by 17.9 per cent in value terms and 35 per cent in volume terms during 2024-25 (Chart II.4.4).
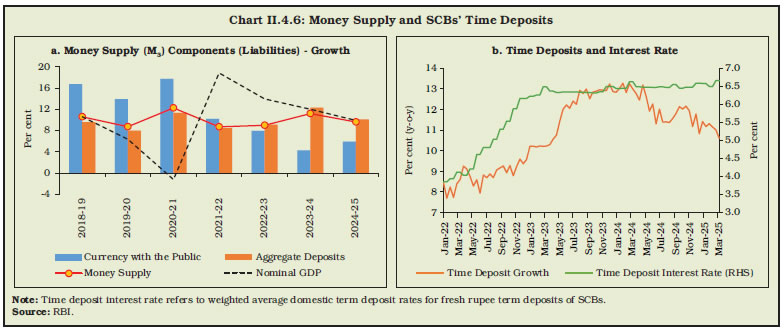
II.4.8 On the sources side (assets), RM comprises net domestic assets (NDA)21 and net foreign assets (NFA)22 of the Reserve Bank. During 2024-25, NFA expanded by ₹2.8 lakh crore, although growth in FCA decelerated with net sales to authorised dealers at ₹2.9 lakh crore as against net purchases of ₹3.4 lakh crore during the previous year. The share of gold in NFA increased to 12.0 per cent as at end-March 2025 from 8.3 per cent as at end-March 2024, mainly due to revaluation gains from gold prices. The Reserve Bank’s net credit to the government expanded during the year owing to the liquidity injection through purchase of G-secs via open market operations (OMOs) during January-March 2025 (Chart II.4.5). 3. Money Supply23 II.4.9 Money supply – in terms of broad money (M3) – mainly consists of currency with the public (CwP) and aggregate deposits (AD) of banks on the components side (liabilities). M3 recorded a growth of 9.6 per cent as on March 21, 2025 as compared with 11.2 per cent a year ago, driven by bank deposits (Chart II.4.6). The expansion in bank deposits24 outpaced that in CwP for the third consecutive year. The ratio of M3 to GDP remained broadly at the level of the previous year (Chart II.4.7). 
 II.4.10 On the sources side (assets), the expansion in M3 was mainly driven by bank credit to the commercial sector, which grew by 11.8 per cent in 2024-25 (15.6 per cent a year ago). Net bank credit to government increased by 11.2 per cent in 2024-25 (5.7 per cent a year ago). The excess holdings of statutory liquidity ratio (SLR) securities25 of SCBs were 10.3 per cent of NDTL as on March 21, 2025. The net foreign assets of the banking sector increased, mirroring the expansion in NFA of the Reserve Bank’s balance sheet during the year (Charts II.4.5 and II.4.8; Table II.4.1). Key Monetary Ratios II.4.11 The transaction velocity of money, i.e., nominal GDP as a proportion of M3, remained stable during 2024-25. The currency-deposit ratio at 15.4 per cent as on March 21, 2025 moderated further from 15.9 per cent as on March 22, 2024, reflecting, inter alia, an increasing shift in public preference towards digital modes of payments. The reserve-deposit ratio softened during the year due to reduction in CRR (Chart II.4.9a). The cumulative impact of moderation in both currency-deposit ratio and reserve-deposit ratio reflected on the money multiplier (MM), which increased to 5.7 as on March 21, 2025 from 5.4 as on March 22, 2024 (Chart II.4.9b). | Table II.4.1: Monetary Aggregates | | Item | Outstanding as on March 21, 2025
(₹ lakh crore) | Growth Rate^ (per cent, y-o-y) | | 2022-23 | 2023-24 | 2024-25 | | 1 | 2 | 3 | 4 | 5 | | I. Reserve Money (RM) | 48.4* | 9.7 | 6.7 | 3.3 | | | | (7.4) | (6.7) | (5.8) | | II. Money Supply (M3) | 272.1 | 9.0 | 11.2 | 9.6 | | III. Major Components of M3 | | | | | | III.1. Currency with the Public | 36.2 | 7.9 | 4.3 | 5.9 | | III.2. Aggregate Deposits | 234.8 | 9.1 | 12.3 | 10.1 | | IV. Major Sources of M3 | | | | | | IV.1. Net Bank Credit to Government | 81.4 | 11.5 | 5.7 | 11.2 | | IV.2. Bank Credit to Commercial Sector | 186.4 | 14.4 | 15.6 | 11.8 | | IV.3. Net Foreign Assets of the Banking Sector | 59.8 | -0.6 | 12.2 | 8.0 | | V. Money Multiplier (Ratio) | 5.7 | | | | *: Data for RM pertain to March 28, 2025.
^: Data for RM and M3 relate to last Friday and last reporting Friday of the financial year, respectively.
Note: 1. Figures in parentheses indicate growth in RM adjusted for the first-round impact of CRR changes.
2. Data are provisional.
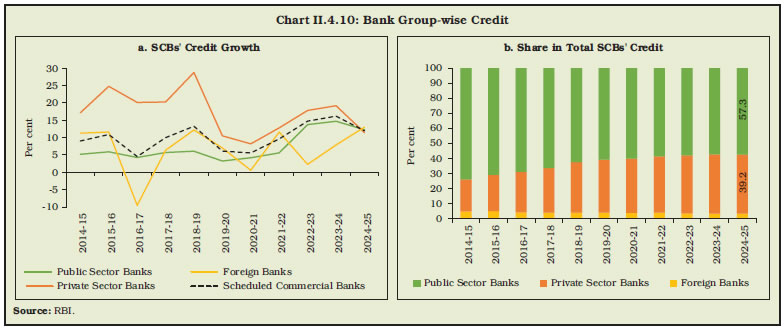
Source: RBI. | 4. Credit II.4.12 Double digit growth in bank credit was sustained during 2024-25, led by retail and services sectors (Box II.4.1). Bank group-wise, public sector banks (PSBs) registered higher credit growth than that of private sector banks (PVBs), with the former maintaining the largest share in total credit (Chart II.4.10). 
Box II.4.1 Drivers of Firm Demand for Credit Bank credit growth remains in double digits, albeit with some moderation. To explore the role of firm characteristics and macroeconomic conditions in determining firm-level borrowing (from banks as well as total borrowings), the following regression equation adapted from Ottonello and Winberry (2020) is estimated for Indian non-financial firms for the period 2013-14 to 2023-24:  where ‘i’, ‘s’ and ‘t’ denote firm, sector and time, respectively; αi and αs refer to firm and sector fixed effects, respectively; ‘X’ denotes firm-specific controls [viz., leverage, size, age, liquidity, growth in sales and investment, and interest coverage ratio (ICR)]; and ‘A’ denotes aggregate control (viz., non-agricultural real GVA growth). Spread, a proxy for the relative cost of funds, captures the difference between sector specific weighted average lending rates (WALR) and market-based funds [external commercial borrowing (ECB)] rate. The interaction terms with spread allow the impact of spread on debt growth to vary depending on the firm’s existing leverage and access to alternative funding. Regression results indicate that larger firms are less likely to borrow, which could be due to better availability of internal resources (Table 1). Older firms, while using less bank credit, have higher total debt, likely using non-bank funding for expansion or refinancing. Sales growth, pre-COVID, positively correlates with bank borrowing for expansion, though this relationship weakened post-COVID. Firms with better liquidity and ICR borrow more, reflecting stronger financials, while highly leveraged firms borrow less on aggregate, potentially deleveraging or facing funding constraints. Higher domestic growth increases overall funding demand for business activity. Higher relative bank loan costs drive firms, especially in services, towards cheaper market-based funding. Firms with non-bank funding access are more sensitive to these cost differences, increasing total borrowing when bank loans become expensive. Overall, firm-specific factors, macroeconomic conditions, and relative funding costs are key borrowing determinants, varying across sectors and time. Given strong bank balance sheets, a revival in private investment can potentially drive increased demand for bank credit. Table 1: Estimated Firm-Level Borrowing
Dependent Variable: Δ log(Debti,t) | | Explanatory Variable | Coefficients | | All Sectors | Services Sector | | Borrowings from Banks | Total Borrowings | Borrowings from Banks | Total Borrowings | | 1 | 2 | 3 | 4 | 5 | | | Spreads,t * NonBank | 0.005 | 0.014* | 0.010 | 0.013 | | | | (0.011) | (0.008) | (0.025) | (0.015) | | | Leveragei,t-1* Spreads,t | 0.014** | 0.007* | 0.026** | 0.005 | | | | (0.006) | (0.004) | (0.011) | (0.008) | | | Spread s,t | -0.060** | 0.088*** | -0.126** | 0.164*** | | | | (0.028) | (0.020) | (0.051) | (0.038) | | | Size i,t-1 | -0.277*** | -0.363*** | -0.452*** | -0.585*** | | | | (0.081) | (0.058) | (0.145) | (0.102) | | | Age i,t-1 | -0.052*** | 0.048*** | -0.082*** | 0.095*** | | | | (0.017) | (0.013) | (0.029) | (0.023) | | | Sales Growth i,t-1 | 0.010 | -0.011 | 0.002 | -0.007 | | | | (0.014) | (0.008) | (0.023) | (0.015) | | | Investment Growth i,t-1 | 0.007 | -0.006 | 0.005 | 0.006 | | Firm Controls | | (0.012) | (0.008) | (0.017) | (0.014) | | | Liquidity i,t-1 | 0.266*** | 0.202*** | 0.273*** | 0.200*** | | | | (0.079) | (0.041) | (0.100) | (0.051) | | | Leverage i,t-1 | -0.227** | -0.197*** | -0.314*** | -0.218*** | | | | (0.044) | (0.030) | (0.086) | (0.059) | | | ICR i,t-1 | 0.035 | 0.070*** | 0.025 | 0.059** | | | | (0.028) | (0.022) | (0.027) | (0.025) | | Aggregate Control | Non-agri Growth t-1 | -1.151*** | 1.386*** | -2.161** | 2.412*** | | | | (0.428) | (0.297) | (0.835) | (0.599) | | R-squared | | 0.156 | 0.219 | 0.188 | 0.246 | | Number of Observations | | 13,260 | 15,362 | 4,243 | 5,456 | ***, ** and * represent significance levels at 1 per cent, 5 per cent and 10 per cent, respectively.
Note: 1. Figures in parentheses indicate robust standard errors.
2. Unit-level data, accessed from CMIE Prowess, include those firms which have at least three years of data on outstanding debt; and also, do not belong to finance, insurance, real estate, utilities and public administration. All other data are sourced from DBIE, RBI.
3. Services sector includes wholesale and retail trade, transport, information and communication technology, professional and other services.
4. Firm and sector fixed effects have been included.
5. Dependent variable captures change in log of real debt outstanding as a total or from banks. Firm-specific controls include lagged values of size (log of real total assets), age in years since incorporation, growth in real sales, growth in real investment, leverage (ratio of total debt to total assets) and liquidity (quick ratio). Investment denotes changes to real total capital and includes both fixed and intangible assets. ICR denotes ratio of earnings to interest expense. Real variables are obtained using non-agricultural GDP deflator. Non-agricultural real GVA growth is in y-o-y growth terms.
6. Leverage has been demeaned for the firm, and all firm-specific variables have been standardised across the sample, enabling better comparison across firms and sectors over time.
7. Non-bank dummy takes value 1 if a firm has accessed credit from a non-bank source (viz., domestic financial market and ECBs) during the sample period. Dummies are also included for asset quality review (2015-16), COVID-19 (2020-21) and merger of a non-bank with a bank (2023-24).
Source: RBI staff estimates. | Reference: Ottonello, P. and Winberry, T. (2020), ‘Financial Heterogeneity and the Investment Channel of Monetary Policy’, Econometrica, 88: 2473-2502. | II.4.13 Sector-wise26, credit to agriculture and allied activities continued to exhibit double digit expansion in 2024-25. Industrial credit remained robust, driven by a pick-up in credit to medium and large industry. Credit to micro and small industries continued albeit with some moderation in the recent period. Similarly, credit to services sector grew but at a decelerated pace. Credit to services sector moderated from elevated levels, following the increase in risk weights on SCBs’ credit to NBFCs by 25 percentage points in November 2023. Personal loans grew by 14.0 per cent as at end-March 2025 as compared with 17.6 per cent during the previous year, supported by housing loans which account for nearly half of the segment. Other segments within personal loans such as vehicle loans and other personal loans grew by 8.6 and 8.4 per cent, respectively, at end-March 2025 (Chart II.4.11 and Table II.4.2). | Table II.4.2: Sectoral Credit Growth - SCBs | | (Per cent, y-o-y) | | Sector | 2023-24# | 2024-25 | | Apr | May | Jun | Jul | Aug | Sep | Oct | Nov | Dec | Jan | Feb | Mar | | 1 | 2 | 3 | 4 | 5 | 6 | 7 | 8 | 9 | 10 | 11 | 12 | 13 | 14 | | Non-food Credit | 16.3 | 15.3 | 16.2 | 13.9 | 15.1 | 15.0 | 14.4 | 12.8 | 11.8 | 12.4 | 12.5 | 12.0 | 12.0 | | I. Agriculture & Allied Activities | 20.0 | 19.8 | 21.6 | 17.4 | 18.1 | 17.7 | 16.4 | 15.5 | 15.3 | 12.5 | 12.2 | 11.4 | 10.4 | | II. Industry (Micro & Small, Medium and Large) | 8.0 | 6.9 | 8.9 | 7.7 | 10.2 | 9.8 | 9.1 | 8.0 | 8.1 | 7.4 | 8.2 | 7.3 | 8.0 | | II.1. Micro & Small | 14.4 | 15.2 | 15.3 | 10.7 | 13.3 | 13.6 | 13.5 | 10.1 | 10.2 | 9.9 | 9.6 | 9.8 | 9.1 | | II.2. Medium | 13.2 | 13.1 | 15.3 | 12.5 | 17.0 | 19.3 | 20.5 | 19.7 | 20.1 | 20.0 | 18.5 | 18.1 | 18.6 | | II.3. Large | 5.8 | 4.1 | 6.5 | 6.3 | 8.7 | 7.8 | 6.6 | 6.1 | 6.3 | 5.3 | 6.7 | 5.4 | 6.4 | | Major Sub-sectors of Industry | | | | | | | | | | | | | | | II.a. Infrastructure | 5.6 | 3.9 | 6.3 | 4.6 | 4.0 | 3.8 | 2.2 | 1.8 | 1.7 | 1.2 | 1.8 | 1.1 | 1.7 | | II.b. Basic Metals & Metal Products | 11.7 | 11.4 | 13.4 | 11.3 | 13.4 | 16.1 | 15.5 | 15.5 | 16.0 | 13.4 | 14.4 | 13.3 | 13.0 | | II.c. Chemicals & Chemical Products | 11.2 | 13.3 | 13.6 | 11.7 | 16.7 | 15.9 | 14.9 | 12.8 | 11.5 | 7.1 | 9.6 | 6.8 | 7.4 | | II.d. Textiles | 11.1 | 8.1 | 9.3 | 6.1 | 8.6 | 6.4 | 5.4 | 5.6 | 5.5 | 5.6 | 5.8 | 7.1 | 8.3 | | II.e. All Engineering | 10.5 | 9.4 | 10.5 | 8.7 | 10.8 | 16.6 | 15.7 | 14.5 | 18.3 | 19.5 | 18.1 | 19.0 | 22.1 | | II.f. Food Processing | 14.9 | 17.9 | 14.5 | 10.8 | 17.1 | 14.4 | 11.6 | 9.9 | 12.1 | 10.7 | 11.0 | 9.3 | 5.1 | | III. Services | 20.8 | 19.5 | 20.7 | 15.1 | 15.9 | 15.6 | 15.2 | 14.1 | 14.4 | 13.0 | 13.8 | 13.0 | 13.4 | | III.1. Trade | 17.2 | 14.4 | 17.3 | 14.4 | 15.6 | 15.7 | 14.5 | 12.6 | 14.7 | 14.2 | 14.6 | 14.8 | 15.8 | | III.2. NBFCs | 15.0 | 15.1 | 15.8 | 8.2 | 13.0 | 12.2 | 9.7 | 6.6 | 8.0 | 6.9 | 7.9 | 6.6 | 5.9 | | IV. Personal Loans | 17.6 | 17.0 | 19.3 | 16.6 | 17.3 | 17.4 | 16.4 | 15.8 | 16.3 | 14.9 | 14.2 | 14.0 | 14.0 | | IV.1. Consumer Durables | 13.0 | 11.0 | 15.0 | 7.6 | 11.3 | 10.1 | 8.6 | 6.6 | 4.8 | -1.1 | -2.6 | 2.2 | -1.3 | | IV.2. Housing | 17.1 | 17.6 | 19.9 | 18.2 | 19.1 | 19.7 | 18.3 | 17.8 | 18.0 | 16.7 | 15.5 | 15.6 | 15.3 | | IV.3. Credit Cards Outstanding | 25.6 | 23.0 | 26.2 | 23.3 | 22.0 | 19.9 | 18.0 | 16.9 | 18.1 | 15.6 | 13.0 | 11.2 | 10.6 | | IV.4. Vehicle Loans | 17.6 | 17.2 | 18.4 | 15.5 | 14.6 | 14.5 | 13.9 | 12.0 | 10.3 | 8.8 | 9.7 | 9.6 | 8.6 | | IV.5. Other Personal Loans | 18.6 | 15.8 | 17.1 | 13.1 | 13.5 | 13.0 | 11.8 | 11.2 | 12.2 | 9.7 | 9.2 | 8.4 | 8.4 | #: March 2024 over March 2023.
Note: Data are provisional and exclude the impact of merger of a non-bank with a bank.
Source: RBI. |
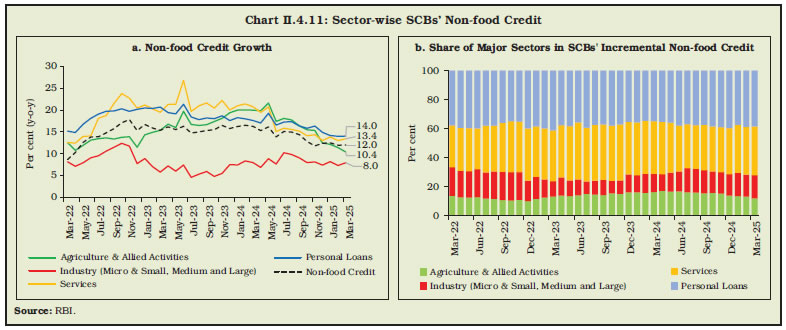 II.4.14 SCBs’ deposit growth remained below that of bank credit during 2024-25; however, the wedge between deposit and credit growth narrowed which led to a decline in the incremental credit-deposit ratio (Chart II.4.12). To bridge the funding gap, banks took recourse to large issuances of certificates of deposit (CDs)27. 5. Conclusion II.4.15 Double digit growth in bank deposits and credit was sustained during 2024-25. Although deposit growth trailed credit growth, the gap narrowed during the year. Bank credit expansion was largely broad-based, led by retail, services and agriculture sectors. Currency demand growth remained moderate with increasing public preference for digital modes of payments. II.5 FINANCIAL MARKETS II.5.1 Global financial markets remained volatile during 2024-25, driven by the uncertain trajectory of monetary policy normalisation amidst sticky services inflation, persisting geopolitical tensions, and geoeconomic fragmentation. With inflation gradually moving towards its target from multi-decadal highs, several central banks embarked on policy pivots during the year. A few central banks continued with monetary tightening on the back of elevated inflation while others maintained a pause. II.5.2 Domestic financial markets exhibited resilience notwithstanding global headwinds and occasional volatility spikes in some market segments during 2024-25. Money market rates remained relatively stable and evolved in sync with liquidity conditions. Issuances of certificates of deposit (CDs) increased as banks supplemented their deposit resources. Sovereign bond yields softened on the back of inclusion of Indian sovereign bonds in major global bond indices, ongoing fiscal consolidation, decline in crude oil prices, and beginning of the monetary easing cycle. Corporate bond yields also softened tracking government security (G-sec) yields along with a widening of spreads amidst moderation in corporate earnings and growth trajectory. Equity markets registered fresh highs in the first half of the year whereas the second half witnessed a correction due to domestic and global factors. During 2024-25, the Indian Rupee (INR) exhibited orderly movements with a depreciation bias amid resurgence in the US dollar index (DXY), heightened global uncertainties and portfolio investment outflows. II.5.3 Against this backdrop, money market developments are detailed in sub-section 2. Market developments in government securities (G-secs) and corporate bonds are discussed in sub-sections 3 and 4, respectively. Equity and foreign exchange market developments are covered in sub-sections 5 and 6, respectively, with concluding observations in sub-section 7. 2. Money Market II.5.4 During 2024-25, money market rates oscillated largely within the policy corridor in tune with the evolving liquidity conditions. Liquidity conditions moved from deficit during Q1:2024-25 to surplus in Q2 and in major part of Q3 (till first half of December 2024) but transited to deficit in Q4 (see Chapter III). The weighted average call rate (WACR) – the operating target of monetary policy – remained within the policy corridor notwithstanding intermittent breaches. It traded above the policy repo rate in Q1; generally hovered around the policy repo rate in Q2; firmed up towards the end of Q3; and remained above the policy repo rate in Q4 (Chart II.5.1). The average spread of the WACR over the policy repo rate moderated to 6 basis points (bps) in 2024-25 from 13 bps in 2023-24. II.5.5 Volatility in the WACR, measured by the coefficient of variation28, moderated to 2.2 per cent in 2024-25 from 2.5 per cent in 2023-24. The average daily volume in the money market increased by 10 per cent to ₹5.5 lakh crore during 2024-25 from the previous year. The money market continued to be dominated by the collateralised segment, with the share of call/notice money being mostly stable at 2 per cent. Within the collateralised segment, the share of triparty repo rose from 66 per cent in Q1:2024-25 to 72 per cent in Q3:2024-25, before declining to 68 per cent in Q4 with concomitant change in the share of market repo (Chart II.5.2).  II.5.6 In other segments of the money market, the average daily spread of CD and commercial paper (CP) rates over treasury bill (T-bill) rates of corresponding maturity increased during 2024-25 on the back of higher issuances of CDs and CPs and regulatory measures on consumer credit and bank credit to non-banking financial companies (NBFCs) announced by the Reserve Bank on November 16, 2023 (Chart II.5.3). II.5.7 In the primary market, fresh issuance of CDs increased to ₹2.8 lakh crore in Q2:2024-25 from ₹2.5 lakh crore in Q1 and further to ₹2.9 lakh crore in Q3 amidst credit growth remaining higher than deposit growth and stood at ₹3.7 lakh crore in Q4. Total CD issuances amounted to ₹11.9 lakh crore during 2024-25 as compared to ₹8.7 lakh crore during the previous year. Banks used CDs to bridge the credit-deposit gap in 2024-25, with liquidity conditions influencing CD rate spreads over WACR (Box II.5.1). 

Box II.5.1 What Drives the Money Market Term Spread? Credit growth has outpaced deposit growth since February 2022 with bank credit registering double digit growth since April 2022. This, inter alia, has resulted in banks taking increasing recourse to issuances of CDs to meet the funding gap (Chart 1). CD issuances are often costlier relative to deposits and more sensitive to demand-supply dynamics based on the evolving liquidity and financial conditions (Chart 2). As suggested by the liquidity preference theory of the term structure, investors prefer short tenor instruments that are more liquid vis-à-vis longer tenor. Risk averse investors would, therefore, demand sufficient liquidity premium to hold longer tenor instruments. The spread of CD rates over WACR, therefore, constitute such a premium.29 The WACR – being the operating target of monetary policy – is broadly reflective of liquidity conditions in the overnight money market. Given its information content and its role as a signaling mechanism, movements in WACR gets transmitted to the outer segment of the money market including CDs. The transmission of signals from WACR to CDs could be more than proportionate in certain periods of liquidity stress or if funding gaps are persistent because of an increasing wedge between credit and deposit growth.  The concentration of money market activity in the overnight segment along with the relative illiquidity between 3-days and three months maturity may also impact the spread between WACR and CD rates. Drawing from the literature on the term premium (Patra et al., 2020), the spread of CD rate over WACR is examined. In this regard, modelling the spread of CD rate over WACR could be useful in comprehending how liquidity and credit market conditions affect the CD market, given the increasing issuance of CDs. The potential determinants of the spread of CD rate over WACR30 are explored using generalised autoregressive conditional heteroscedasticity (GARCH) approach. Based on the money market dynamics, the selected explanatory variables include daily net LAF outstanding (NLAF), VIX index, and a dummy variable (DUM-CDGap). The NLAF and VIX capture the liquidity conditions and uncertainty in financial markets, respectively, while DUM-CDGap represents the evolving demand-supply pressures in the credit market which, in turn, gets reflected in the CD market. The GARCH model is employed to analyse the spread based on daily data spanning January 1, 2020 - September 30, 2024. Thus, the sample covers both easing and tightening phases of monetary policy as well as periods when credit growth lagged deposit growth and vice versa. Under the GARCH (1,1)-X framework, the mean equation is modelled as follows: The spread of CD rate is influenced by past values, with Xt as a vector of explanatory variables and an error term reflecting shocks that impact the CD rates. The error term is a function of lagged information matrix Ω-1 and is assumed to be normally distributed with zero mean. The variance ht is defined as: where α1, α2 and α3 are coefficients of ARCH, GARCH effects and volatility in financial markets. The regression results indicate that an improvement in system liquidity has a moderating (statistically significant) impact on the spread of CDs, while increasing wedge between credit and deposit growth elongates the spread. The interactive term of NLAF and DUM-CDGap31 suggest that although the sobering impact of system liquidity remains statistically significant, the effect wanes when credit growth is faster than that of deposits. Moreover, the estimates of conditional volatility reveal that volatility of the spread was generally low, barring a few episodes including COVID-19 (Table 1 and Chart 3). The residual diagnostics show no ARCH effects and no autocorrelation in residuals. 
| Table 1: GARCH (1,1) Estimation Results | | | Model 1 | Model 2 | Model 3 | | Mean equation: | | | | | Spreadt = β0 + β1 Spreadt-1 + β2 Xt + Ɛt | | | | | Constant | 5.133*** | 2.743*** | 5.902*** | | | (0.659) | (1.043) | (0.655) | | Spreadt-1 | 0.922*** | 0.906*** | 0.910*** | | | (0.009) | (0.010) | (0.009) | | DUM-CDGapt | | 3.617** | | | | | (1.069) | | | NLAFt | -0.467*** | -0.116 | -0.653*** | | | (0.114) | (0.164) | (0.120) | | NLAFt | | | 0.612*** | | X | | | (0.209) | | DUM -CDGapt | | | | | Variance equation: | | | | | ht = α0 + α1Ɛ2 t-1 + α2ht-1 + α3 VIXt | | | | | ARCH (1) | 0.380*** | 0.390*** | 0.384*** | | | (0.042) | (0.044) | (0.043) | | GARCH (1) | 0.294*** | 0.292*** | 0.300*** | | | (0.052) | (0.053) | (0.054) | | VIXt | 5.344*** | 5.169*** | 5.185*** | | | (0.499) | (0.486) | (0.506) | | Diagnostics: | | | | | Log likelihood: | -3453.49 | -3449.29 | -3450.20 | | Total Observations: | 907 | 907 | 907 | | ARCH (LM) Prob. (F): | 0.920 | 0.875 | 0.893 | | Akaike Info Criterion: | 7.768 | 7.760 | 7.762 | ***, **, and * indicate significance levels at 1 per cent, 5 per cent and 10 per cent, respectively.
Note: Figures in parentheses are standard errors.
Source: RBI staff estimates. | References: 1. FBIL (2020), ‘Indian CD Market: 2013-2019’, FBIL Thematic Study, July. 2. Patra, M. Behera, H. and John, J. (2020), ‘Revisiting the Determinants of the Term Premium in India’, RBI Bulletin, November. 3. Priyadarshini, P., Anshul, Sardar, S., Chaudhari, D.R., and Das, S. (2024), ‘Drivers of Commercial Paper Rate Spread - An Empirical Assessment’, RBI Working Paper Series, March. | II.5.8 New issuances of CPs in the primary market, which moderated to ₹3.7 lakh crore in Q2:2024-25 from ₹3.8 lakh crore in Q1, rebounded to ₹3.8 lakh crore in Q3 and stood at ₹4.4 lakh crore in Q4. During 2024-25, fresh issuances of CPs increased to ₹15.7 lakh crore due to sustained demand and the regulatory measures on NBFCs mentioned earlier, as compared to ₹13.8 lakh crore during the previous year. 3. Government Securities Market II.5.9 During Q1:2024-25, G-sec yields exhibited two-way movements. Yields initially rose at the beginning of the quarter amid foreign portfolio investment (FPI) outflows and higher crude oil prices but softened thereafter in the wake of record surplus transfer by the Reserve Bank to the central government, FPI buying ahead of bond index inclusion32 and decline in crude oil prices. The 10-year generic G-sec yield closed the quarter at 7.01 per cent, a decline of 5 bps from its level as at end-March 2024 (Chart II.5.4).  II.5.10 During Q2:2024-25, G-sec yields for the shorter tenor declined more than the longer tenor amidst steepening of yield curves globally, fall in crude oil prices, continued FPI inflows and beginning of rate easing cycle by major central banks, including a 50-bps rate cut by the US Fed. The government’s commitment towards fiscal prudence as reflected in the Union Budget 2024-25 along with lower CPI inflation prints for July and August – below 4.0 per cent for the first time since September 2019 – also led to softening of G-sec yields during the quarter. The 10-year generic G-sec yield closed the quarter at 6.75 per cent, a decline of 26 bps from its level at end-June 2024 – the biggest quarterly decline since the quarter ended March 2020. II.5.11 During Q3:2024-25, G-sec yields were range-bound with upward pressures from higher US treasury yields and domestic CPI inflation being somewhat ameliorated by the monetary policy committee’s (MPC’s) decision to change the monetary policy stance to neutral and the announcement of the Indian government bonds’ inclusion in FTSE Russell index33. The 10-year generic G-sec yield closed at 6.76 per cent at end-December 2024, almost unchanged from its level at end-September 2024. II.5.12 During Q4:2024-25, G-sec yields largely trended downwards amid several liquidity infusion measures and commencement of monetary policy easing cycle by the Reserve Bank. The yields rose in the first fortnight of Q4 to touch a high of 6.87 per cent amid rise in US treasury yields. Thereafter, yields broadly trended downward on account of liquidity management measures, viz., daily variable rate repo (VRR) auctions on all working days, OMO purchases of government securities, longer tenor VRR auctions and USD/INR buy-sell swap auctions. OMO purchases aggregating ₹2.83 lakh crore and USD/INR buy-sell swaps amounting to ₹2.18 lakh crore were conducted during the quarter34. In the February bi-monthly meeting, the MPC unanimously decided to cut the policy repo rate by 25 bps. The 10-year generic G-sec yield closed at 6.58 per cent as at end-March 2025, 18 bps lower than its level as at end-December 2024. During 2024-25, the domestic yield curve bull steepened as the 10-year generic G-sec yield softened by 48 bps while the 5-year generic G-sec yield softened by 61 bps. | Table II.5.1: FPI Investment in Debt Instruments (End-March) | | (Amount in ₹ lakh crore) | | Route/ Channel of Investment | 2023 | 2024 | 2025 | | Limit | Outstanding | Utilisation
(per cent of limit) | Limit | Outstanding | Utilisation
(per cent of limit) | Limit | Outstanding | Utilisation
(per cent of limit) | | 1 | 2 | 3 | 4 | 5 | 6 | 7 | 8 | 9 | 10 | | General Route^ | 11.7 | 1.8 | 15.4 | 11.7 | 1.9 | 16.0 | 13.0 | 1.9 | 14.5 | | VRR^ | 2.5 | 2.1 | 82.0 | 2.5 | 1.8 | 70.1 | 2.5 | 2.1 | 82.1 | | FAR# | 28.0 | 0.8 | 2.8 | 39 | 1.7 | 4.5 | 43.4 | 3.1 | 7.1 | ^: Includes central government securities (G-secs), state government securities (SGSs) and corporate bonds.
#: Available only for the specified securities included under the route.
Source: CCIL and NSDL. | II.5.13 With the introduction of the fully accessible route (FAR)35 effective April 1, 2020, FPIs have three channels of investment – the general route36; the voluntary retention route (VRR); and FAR (Table II.5.1). In aggregate, FPIs invested ₹1.5 lakh crore in debt instruments in 2024-25. 4. Corporate Bond Market II.5.14 Corporate bond yields softened during 2024-25, mirroring G-sec yields. The monthly average yield on AAA-rated 3-year bonds of public sector undertakings (PSUs), financial institutions (FIs) and banks; non-banking financial companies (NBFCs); and corporates fell by 15 bps, 28 bps and 33 bps, respectively, in March 2025 vis-à-vis March 2024 (Table II.5.2). II.5.15 The spread on AAA-rated 3-year bond yields over G-sec yields of corresponding maturity, however, increased during 2024-25, as the pace of softening in corporate bond yields trailed that in G-sec yields. The increase in spreads was evident across tenors and the rating spectrum. Average daily turnover37 in the secondary market on corporate bonds increased to ₹7,645 crore during 2024-25 from ₹5,722 crore during the previous year (Chart II.5.5). | Table II.5.2: Corporate Bonds* - Yields and Spread | | Entity | Yields
(per cent) | Spread (bps)
[over corresponding risk-free rate] | | March 2024 | March 2025 | Change (bps) | March 2024 | March 2025 | Change (bps) | | 1 | 2 | 3 | 4 (=3-2) | 5 | 6 | 7 (=6-5) | | (i) PSUs, FIs and Banks | 7.63 | 7.48 | -15 | 44 | 83 | 39 | | (ii) NBFCs | 7.98 | 7.70 | -28 | 80 | 106 | 26 | | (iii) Corporates | 7.95 | 7.62 | -33 | 77 | 98 | 21 | *: AAA-rated 3-year bonds.
Note: Yields and spreads are computed as monthly averages.
Source: FIMMDA. | II.5.16 Primary issuances of listed corporate bonds on domestic stock exchanges rose during 2024-25 along with an increase in mobilisation through overseas issuances (Table II.5.3). Private placements remained the preferred channel, accounting for 99.2 per cent of total resources mobilised through the domestic bond market. Investments by FPIs in corporate bonds increased during the year. The utilisation of the approved limits, however, declined to 15.8 per cent as at end-March 2025 from 16.2 per cent as at end-March 2024, as the absolute limits for FPI investments in corporate bonds increased. 5. Equity Market II.5.17 In 2024-25, the Indian equity market witnessed fresh highs in the first half whereas the second half exhibited sharp correction on account of a set of factors, viz., shifting expectations on global monetary policy trajectory, tariff policies in the US and lingering geopolitical tensions in the Middle East and Europe. Overall, the BSE Sensex gained 5.1 per cent to close at 77,415 at end-March 2025 (Chart II.5.6). Resource mobilisation in the primary markets through public and rights issues, preferential allotments and qualified institutional placements (QIPs) maintained robust growth, particularly in H1: 2024-25. | Table II.5.3: Corporate Bond Market | | Item | Amount
(₹ lakh crore) | Variation
(Col. 3 over Col. 2) [per cent] | | 2023-24 | 2024-25 | | 1 | 2 | 3 | 4 | | (i) Primary Corporate Bond Issuances | 8.6 | 9.9 | 16.1 | | (ii) Outstanding Corporate Bonds (end-December) | 45.5 | 51.6 | 13.3 | | (iii) Investments by FPIs in Corporate Bonds (end-March) | 1.08 | 1.21 | 11.4 | | Source: SEBI and NSDL. |
 II.5.18 Equity markets started on a positive note in Q1:2024-25 amidst encouraging domestic and global macroeconomic data releases, interspersed by brief correction due to flaring up of geopolitical tensions in the Middle East. During Q2, the market continued the upward trajectory with the BSE Sensex crossing the 80,000 mark in July with headwinds in early August following the release of weaker economic data from the US and large-scale unwinding of the Yen carry trade post-rate hike by the Bank of Japan. After remaining range bound in the first half of September, the BSE Sensex rallied sharply to breach the 85,000 mark - touching a new high of 85,836 on September 26, 2024, supported by expectations of an imminent US Fed policy pivot. II.5.19 In Q3, Indian equity markets exhibited a declining trend on FPI selling amidst geopolitical tensions, concerns over domestic equity valuations and weaker-than-expected corporate earnings results and domestic GDP print in Q2:2024-25. Some of the declines were reversed in late November and early December on favourable global cues. Benchmark indices declined further in Q4 amidst sustained FPI selling on tariff announcements by the US against major economies, weak domestic growth outlook based on the GDP estimates for 2024-25, and mixed corporate earnings in Q3:2024-25. Markets, however, pared some of the losses in the second half of March amidst FPI buying and expectations of further monetary policy easing. II.5.20 The broader market indices, viz., the BSE MidCap and BSE SmallCap, increased by 5.6 per cent and 8 per cent, respectively, while sectoral indices exhibited a mixed trend in 2024-25 (Chart II.5.7a). FPIs made net sales of ₹1.4 lakh crore in the domestic equity market during 2024-25 as against net purchases of ₹2.1 lakh crore in the previous year (Chart II.5.7b). Mutual funds made net purchases of ₹4.7 lakh crore in 2024-25 as against ₹2.0 lakh crore in the previous year. Primary Market Resource Mobilisation II.5.21 In the primary segment of the equity market, resource mobilisation through preferential allotments and qualified institutional placements (QIPs) rose to ₹2.2 lakh crore during 2024-25 from ₹1.1 lakh crore during the previous year. Resource mobilisation through initial public offerings (IPOs), follow-on public offers (FPOs) and rights issues also increased to ₹2.1 lakh crore from ₹0.8 lakh crore during the previous year (Chart II.5.8a and Appendix Table 5). Issuances by small and medium enterprises (SMEs) remained robust, raising ₹9,961 crore during 2024-25 as compared to mobilisation of ₹6,122 crore in the previous year. II.5.22 Net resources mobilised by mutual funds increased to ₹8.2 lakh crore during 2024-25 from ₹3.6 lakh crore during the previous year. Net mobilisation by equity-oriented mutual fund schemes rose to ₹4.2 lakh crore from ₹1.8 lakh crore during the previous year. Debt-oriented schemes witnessed net inflows of ₹1.4 lakh crore during 2024-25 as compared with net outflows of ₹0.3 lakh crore during the previous year. Average monthly contribution to mutual funds through the systematic investment plan (SIP) route increased to ₹24,113 crore in 2024-25 from ₹16,602 crore during the previous year (Chart II.5.8b). 6. Foreign Exchange Market II.5.23 The INR, after remaining steady during H1:2024-25, came under pressure in the second half amid adverse external shocks and spillovers and closed the year lower - depreciating by 2.4 per cent. During Q1, the INR traded in a range bound manner, supported by a fall in crude oil prices and net FPI inflows, amid rise in the DXY and hardening US treasury yields. Overall, the INR closed almost flat at ₹83.38 per US dollar by end-June 2024 (Chart II.5.9). II.5.24 The INR traded under depreciation pressure for most of Q2:2024-25 on reported unwinding of carry trades and recessionary fears in the US leading to safe haven demand. However, the fall in crude oil prices and continuing FPI inflows post inclusion of Indian sovereign bonds in J.P. Morgan bond indices kept the INR supported. Overall, the INR closed the Q2 at ₹83.79 per US dollar, lower by 0.5 per cent from its level at end-June 2024.  II.5.25 The depreciation bias continued during Q3:2024-25 amid the surge of the DXY, which rose by 7.7 per cent during the quarter – the highest quarterly rise since Q4:2014-15. Most of the Asian currencies traded under pressure with MSCI Emerging Market Currency Index declining by 3.6 per cent during the quarter – the largest quarterly fall since Q2:2022-23. Equity segment witnessed net FPI outflow of more than US$ 11 billion during October 2024. Overall, the INR closed the quarter at ₹85.62 per US dollar, lower by 2.1 per cent from its level at end-September 2024. II.5.26 The INR continued to trade under pressure during most of Q4:2024-25 amid global uncertainties, tariff related announcements and FPI related outflows. During this period, outflows from the equity segment exceeded US$ 13 billion. However, INR appreciated in March amid softening in the DXY and debt related inflows. Overall, the INR closed at ₹85.46 per US dollar on March 28, 2025, 0.2 per cent higher from its level at end-December 2024. II.5.27 During 2024-25, the forward premia trended largely flat during the first half of the year. It rose subsequently, led by shorter tenors, amid global policy uncertainty and widening interest rate differential before paring some of those movements in Q4. II.5.28 The 40-currency nominal effective exchange rate (NEER) and real effective exchange rate (REER) appreciated (y-o-y) by 0.3 per cent and 1.5 per cent, respectively, during 2024-25. 7. Conclusion II.5.29 During 2024-25, global financial markets remained volatile over protracted geopolitical tensions and persisting uncertainty over the quantum and pace of monetary policy normalisation by the US Fed and other major systemic central banks. Amidst the global headwinds, Indian financial markets demonstrated resilience and orderly movements. Money market rates generally remained aligned with the policy repo rate. G-sec yields softened during the year and exhibited lower volatility than global and emerging market peers. The INR witnessed depreciating bias in the latter half of the year amidst stronger US dollar and portfolio equity outflows. The Indian equity market scaled fresh highs in the first half although it witnessed significant correction in the second half of 2024-25 due to domestic and global factors. Despite moderation in Q4, resource mobilisation in the primary market remained robust in 2024-25. II.6 GOVERNMENT FINANCES II.6.1 During 2024-25, the central and state governments pursued fiscal consolidation supported by robust tax collections. For 2025-26, both the Centre and states have placed greater thrust on capital expenditure. Against this backdrop, sub-sections 2 and 3 elaborate on the fiscal position of the Union government in 2024-25 and 2025-26, respectively. Sub-sections 4 and 5 focus on state government finances during 2024-25 and 2025-26, respectively, followed by the finances of the general government for 2024-25 (BE) in sub-section 6. The final sub-section sets out the concluding remarks. 2. Central Government Finances in 2024-25 II.6.2 During 2024-25 (RE), the Union government contained the gross fiscal deficit (GFD) to 4.7 per cent of GDP – 0.2 per cent below budget estimates (BE) – primarily through containment of revenue and capital expenditure (Table II.6.1 and Chart II.6.1)38. II.6.3 Revenue expenditure rose by 5.8 per cent in 2024-25 (RE), broadly in line with BE. In 2024-25 (RE), interest payments and outgo on major subsidies as per cent of GDP declined by 0.1 per cent and 0.2 per cent, respectively, as compared to 2023-24. Food subsidy was also below its BE by ₹7,830 crore, partly due to cost savings on account of off-loading of wheat and rice in the open market. The expenditure on pensions and retirement benefits increased to 0.83 per cent of GDP in 2024-25 (RE) from 0.79 per cent in the previous year, while grants-in-aid to states declined to 1.6 per cent of GDP from 1.8 per cent during the same period. | Table II.6.1: Central Government’s Fiscal Performance | | (Per cent of GDP) | | Item | Average of 2015-16 to 2018-19 | 2019-20 | 2020-21 | 2021-22 | 2022-23 | 2023-24 | 2024-25 (RE) | 2025-26 (BE) | | 1 | 2 | 3 | 4 | 5 | 6 | 7 | 8 | 9 | | I. Non-debt Receipts | 9.1 | 8.7 | 8.5 | 9.4 | 9.1 | 9.3 | 9.5 | 9.8 | | II. Gross Tax Revenue (a+b) | 11.0 | 10.0 | 10.2 | 11.5 | 11.4 | 11.5 | 11.6 | 12.0 | | a) Direct Tax | 5.7 | 5.2 | 4.8 | 6.0 | 6.2 | 6.5 | 6.8 | 7.1 | | b) Indirect Tax | 5.3 | 4.8 | 5.5 | 5.5 | 5.2 | 5.0 | 4.9 | 4.9 | | III. Net Tax Revenue | 7.1 | 6.7 | 7.2 | 7.6 | 7.8 | 7.7 | 7.7 | 7.9 | | IV. Non-tax Revenue | 1.5 | 1.6 | 1.0 | 1.5 | 1.1 | 1.3 | 1.6 | 1.6 | | V. Non-debt Capital Receipts | 0.5 | 0.3 | 0.3 | 0.2 | 0.3 | 0.2 | 0.2 | 0.2 | | VI. Total Expenditure | 12.6 | 13.4 | 17.7 | 16.1 | 15.6 | 14.8 | 14.2 | 14.2 | | VII. Revenue Expenditure | 10.9 | 11.7 | 15.5 | 13.6 | 12.8 | 11.6 | 11.2 | 11.0 | | VIII. Capital Expenditure | 1.7 | 1.7 | 2.1 | 2.5 | 2.8 | 3.2 | 3.1 | 3.1 | | IX. Revenue Deficit | 2.4 | 3.3 | 7.3 | 4.4 | 4.0 | 2.5 | 1.8 | 1.5 | | X. Gross Fiscal Deficit | 3.5 | 4.6 | 9.2 | 6.7 | 6.5 | 5.5 | 4.7 | 4.4 | BE: Budget Estimates. RE: Revised Estimates.
Source: Union Budget documents. |
 II.6.4 Capital expenditure undershot the BE by ₹92,682 crore and was placed at 3.1 per cent of GDP in 2024-25 (RE) as against 3.2 per cent of GDP in 2023-24 (Table II.6.1). The growth in both capital outlay39 and loans and advances experienced moderation. Effective capital expenditure grew by 5.2 per cent and stood at 4.0 per cent of GDP. II.6.5 In 2024-25 (RE), the gross tax revenue exceeded its BE by ₹13,285 crore, rising to 11.6 per cent of GDP from 11.5 per cent in 2023-24. Strong performance of income tax and goods and services tax (GST) bolstered tax receipts. While growth in custom duty slowed down, that of Union excise duty recovered (Chart II.6.2). II.6.6 Net tax revenue to the Centre grew by 9.9 per cent, lower than the growth of gross tax revenue owing to higher growth in devolution of taxes to the states. Driven by the surplus transfer from the Reserve Bank, the non-tax revenue grew by 32.2 per cent in 2024-25 (RE) over 2023-24. Miscellaneous non-debt capital receipts (including disinvestment receipts) were, however, below their BE by ₹17,000 crore. Total non-debt receipts of the Centre recorded a healthy growth of 12.8 per cent, on top of 13.6 per cent growth attained in 2023-24. 3. Central Government Finances in 2025-26 II.6.7 The Union Budget 2025-26 continued with the government’s commitment towards fiscal consolidation by targeting a GFD of 4.4 per cent of GDP (Table II.6.1 and Appendix Table 6). Fiscal consolidation is expected to be driven by moderation in the revenue expenditure to 11.0 per cent of GDP in 2025-26 (BE) from 11.2 per cent in the previous year. Enhanced tax and non-tax receipts are also expected to support this consolidation. On the expenditure side, interest payments are expected to rise by 12.2 per cent. While the subsidy outgo for fertiliser and petroleum has been budgeted to decline by ₹3,411 crore and ₹2,600 crore, respectively, food subsidy is expected to increase by ₹6,000 crore in 2025-26 (BE). Revenue expenditure on pension and other retirement benefits is budgeted to fall by 0.06 per cent of GDP in 2025-26 (BE) as compared to that in 2024-25 (RE). Moreover, grants-in-aid to the states – driven by a substantial growth of 23.5 per cent – is expected to increase to 1.8 per cent of GDP. II.6.8 Capital expenditure is budgeted to grow by 10.1 per cent and is estimated at 3.1 per cent of GDP in 2025-26 (BE). The capital support to the states through the 50-year interest-free loan has been enhanced to ₹1.5 lakh crore in 2025-26 (BE) from ₹1.3 lakh crore in 2024-25 (RE). With the grants-in-aid for creation of capital assets rising to 1.2 per cent of GDP in 2025-26 (BE), the effective capital expenditure would be 4.3 per cent of GDP as compared with 4.0 per cent in the previous year. The ratio of revenue expenditure to capital outlay (RECO) continues to remain low at 4.4, reflective of the thrust on the quality of government expenditure (Chart II.6.3). II.6.9 The buoyancy of gross tax revenue is budgeted at 1.1 in 2025-26 (BE), with direct taxes at 1.2 [1.5 in 2024-25 (RE)] and indirect taxes at 0.8 [0.7 in 2024-25 (RE)]. The gross tax revenue is budgeted to reach its peak of 12.0 per cent of GDP in 2025-26 (BE), highest post 2007-08 (Chart II.6.4). II.6.10 Gross market borrowings, as per cent of GDP, are expected to slightly decline in 2025-26 (BE) [Chart II.6.5a]. Market borrowings, followed by small savings, remain the main sources of financing the GFD (Chart II.6.5b). 4. State Finances in 2024-25 II.6.11 States had budgeted a GFD of 3.2 per cent of GDP in 2024-25 (Table II.6.2). As per provisional accounts data of 20 states available from the Comptroller and Auditor General (CAG) of India for April 2024-February 2025, states’ GFD stood at 64.2 per cent of their budget estimates, higher than the level recorded a year ago (58 per cent). Revenue receipt growth moderated on account of deceleration in tax revenue growth and decline in grants from the centre. Within states’ own tax revenues, states’ GST (SGST) growth slowed down while sales tax/value-added tax (VAT) collections recovered from a contraction during the same period in the previous year. II.6.12 On the expenditure front, revenue expenditure growth picked up during April 2024-February 2025, while capital expenditure during the same period remained lower than its level a year ago. 5. State Finances in 2025-26 II.6.13 Based on information available for all states/UTs, their consolidated GFD-GDP ratio for 2025-26 is budgeted at 3.3 per cent (Table II.6.3). The gross transfers to states have been budgeted to increase by 12.5 per cent in 2025-26 from 2024-25 (RE), largely on account of transfers under centrally sponsored schemes and special assistance to states for capital expenditure. The scheme of 50-year interest free loans for capital expenditure to states would be continued in 2025-26, with total outlay of ₹1.5 lakh crore – an increase of 20 per cent over 2024-25 (RE) levels. | Table II.6.2: Fiscal Position of States/UTs | | (Amount in ₹ lakh crore) | | | 2020-21 | 2021-22 | 2022-23 | 2023-24 (RE) | 2024-25 (BE) | | 1 | 2 | 3 | 4 | 5 | 6 | | I. Revenue Receipts | 25.9 | 32.3 | 36.5 | 42.1 | 46.7 | | | (13.0) | (13.7) | (13.6) | (14.3) | (14.3) | | II. Non-debt Capital Receipts | 0.2 | 0.2 | 0.1 | 0.4 | 0.4 | | | (0.1) | (0.1) | (0.04) | (0.1) | (0.1) | | III. Revenue Expenditure | 29.6 | 33.3 | 37.2 | 43.5 | 47.5 | | | (14.9) | (14.1) | (13.8) | (14.7) | (14.6) | | IV. Capital Expenditure | 4.6 | 5.7 | 6.7 | 9.3 | 10.0 | | | (2.3) | (2.4) | (2.5) | (3.2) | (3.1) | | a. Capital Outlay | 4.1 | 5.3 | 6.0 | 8.7 | 9.2 | | | (2.1) | (2.3) | (2.2) | (2.9) | (2.8) | | b. Loans and Advances by States | 0.4 | 0.4 | 0.7 | 0.7 | 0.9 | | | (0.2) | (0.2) | (0.3) | (0.2) | (0.3) | | V. Fiscal Deficit | 8.0 | 6.5 | 7.2 | 10.4 | 10.4 | | | (4.1) | (2.8) | (2.7) | (3.5) | (3.2) | | VI. Revenue Deficit | 3.7 | 1.0 | 0.6 | 1.4 | 0.8 | | | (1.9) | (0.4) | (0.2) | (0.5) | (0.2) | | VII. Primary Deficit | 4.2 | 2.3 | 2.6 | 5.2 | 4.8 | | | (2.1) | (1.0) | (1.0) | (1.8) | (1.5) | Note: Figures in parentheses are per cent of GDP.
Source: Budget documents of state governments. |
| Table II.6.3: State Government Finances 2025-26*: Key Deficit Indicators | | (Per cent of GDP) | | Item | 2023-24 | 2024-25 (RE) | 2025-26 (BE) | | 1 | 2 | 3 | 4 | | Revenue Deficit | 0.3 | 0.6 | 0.2 | | Gross Fiscal Deficit | 3.0 | 3.6 | 3.3 | | Primary Deficit | 1.3 | 1.8 | 1.5 | *: Data pertain to all states/UTs that have presented their final budgets for 2025-26.
Source: Budget documents of state governments. | 6. General Government Finances II.6.14 In 2024-25 (BE), the GFD of the general government moderated to 7.6 per cent of GDP40 from 8.8 per cent in 2023-24 (RE). General government debt stood at 81.9 per cent of GDP in 2024-25 (BE) as compared to 81.8 per cent in 2023-24 (RE). External liabilities of the Centre remained low at 2.5 per cent of GDP (Chart II.6.6a and Appendix Table 7). II.6.15 Fiscal consolidation of the general government was supported by rise in tax revenues to 18.8 per cent of GDP in 2024-25 (BE) from 18.1 per cent in the previous year and moderation in total expenditure to 30.0 per cent of GDP from 30.2 per cent in the previous year. Even with containment of total expenditure, the capital expenditure to GDP ratio stood at 5.9 per cent in 2024-25 (BE), as compared to 5.8 per cent in the previous year (Chart II.6.6b). II.6.16 As per the International Monetary Fund (IMF) projections for the period 2025 to 2030, India’s general government debt will be on a declining trend in contrast to its peers and the average position of emerging market and middle-income economies and advanced economies (Chart II.6.7a). The overall balance of the general government is also projected to improve significantly (Chart II.6.7b).
7. Conclusion II.6.17 Fiscal consolidation, through rationalisation of revenue expenditure and enhanced revenue generation, remained a key focus of the Union Budget 2025-26. While focusing on rebuilding its fiscal buffers, the Union government has also maintained its expenditure quality by budgeting a robust growth in its capital expenditure in 2025-26. II.7 EXTERNAL SECTOR II.7.1 India’s external sector exhibited resilience during 2024-25 amidst a challenging global landscape marked by prolonged geopolitical tensions, rising geoeconomic fragmentations and heightened uncertainty related to global trade. India’s merchandise exports recovered; with merchandise imports outpacing exports, merchandise trade deficit widened. Nonetheless, India’s buoyant services exports and strong private transfer receipts contained the current account deficit (CAD) well within sustainable levels. However, with net capital inflows falling short of CAD, there was a decline in foreign exchange reserves on a balance of payments (BoP) basis during April-December 2024. II.7.2 Against this backdrop, sub-section 2 presents a brief overview of global economic and financial conditions, followed by an analysis of India’s merchandise exports and imports in sub-section 3. The behaviour of invisibles is presented in sub-section 4. Details on net capital flows are set out in sub-section 5 while external vulnerability indicators are analysed in sub-section 6 followed by the concluding observations. 2. Global Economic Conditions II.7.3 Global economic growth moderated to 3.3 per cent in 2024 (3.5 per cent in 2023) and is expected to be even lower in 2025 (2.8 per cent)41 [Chart II.7.1a]. Downside risks cloud the growth outlook owing to heightened trade tensions and elevated policy-induced uncertainty. Output growth in advanced economies (AEs) increased marginally to 1.8 per cent in 2024 as compared with 1.7 per cent in 2023, while that in emerging market and developing economies (EMDEs) moderated to 4.3 per cent from 4.7 per cent. The gradual easing of global inflationary pressures prompted major central banks to cut their policy rates, although monetary policy stances still remain in restrictive territory in several jurisdictions. With easing inflationary pressures and stable global demand, world trade volume (goods and services) growth recovered from 1.0 per cent in 2023 to 3.8 per cent in 2024 (Chart II.7.1b). 
 II.7.4 Emerging market economies (EMEs) recorded net portfolio inflows of US$ 255.7 billion during 2024-25 as compared with US$ 220.1 billion during 2023-24 (Chart II.7.2). Global foreign exchange reserves increased during 2024, reflecting valuation gains on account of a rise in gold prices (Chart II.7.3). 3. Merchandise Trade II.7.5 India’s merchandise exports increased marginally by 0.1 per cent year-on-year (y-o-y) to US$ 437.4 billion in 2024-25, recovering from a contraction of 3.1 per cent witnessed in 2023-24. Merchandise imports expanded by 6.2 per cent (y-o-y) to US$ 720.2 billion during 2024-25 vis-à-vis a contraction of 5.3 per cent during the previous year (Table II.7.1). II.7.6 The expansion in merchandise exports in 2024-25 was led by growth in electronic goods; engineering goods; drugs and pharmaceuticals; rice; and readymade garments (RMG) of all textiles; while petroleum products; and gems and jewellery witnessed a contraction (Charts II.7.4 and II.7.5). 
| Table II.7.1: India’s Merchandise Trade | | | Value in US$ billion | Growth Rate
(y-o-y, per cent) | | 2021-22 | 2022-23 | 2023-24 | 2024-25 | 2021-22 | 2022-23 | 2023-24 | 2024-25 | | 1 | 2 | 3 | 4 | 5 | 6 | 7 | 8 | 9 | | Exports | | Q1 | 95.5 | 121.0 | 103.9 | 110.1 | 85.7 | 26.6 | -14.1 | 5.9 | | Q2 | 102.7 | 110.7 | 107.2 | 103.5 | 38.5 | 7.8 | -3.2 | -3.4 | | Q3 | 106.8 | 104.6 | 105.6 | 108.7 | 41.0 | -2.1 | 1.0 | 3.0 | | Q4 | 117.0 | 114.8 | 120.4 | 115.1 | 29.3 | -1.9 | 4.9 | -4.4 | | Annual | 422.0 | 451.1 | 437.1 | 437.4 | 44.6 | 6.9 | -3.1 | 0.1 | | Imports | | Q1 | 127.0 | 183.5 | 160.0 | 172.2 | 107.2 | 44.5 | -12.8 | 7.6 | | Q2 | 147.5 | 189.0 | 170.3 | 186.7 | 62.7 | 28.1 | -9.9 | 9.7 | | Q3 | 167.0 | 176.1 | 176.1 | 187.5 | 50.7 | 5.4 | 0.0 | 6.5 | | Q4 | 171.6 | 167.3 | 171.8 | 173.9 | 30.3 | -2.5 | 2.7 | 1.2 | | Annual | 613.1 | 716.0 | 678.2 | 720.2 | 55.4 | 16.8 | -5.3 | 6.2 | | Trade Balance | | Q1 | -31.4 | -62.6 | -56.2 | -62.1 | | | | | | Q2 | -44.8 | -78.3 | -63.1 | -83.2 | | | | | | Q3 | -60.2 | -71.5 | -70.5 | -78.7 | | | | | | Q4 | -54.6 | -52.6 | -51.4 | -58.8 | | | | | | Annual | -191.0 | -264.9 | -241.1 | -282.8 | | | | | Note: Quarterly figures may not add up to annual figures.
Source: DGCI&S. |
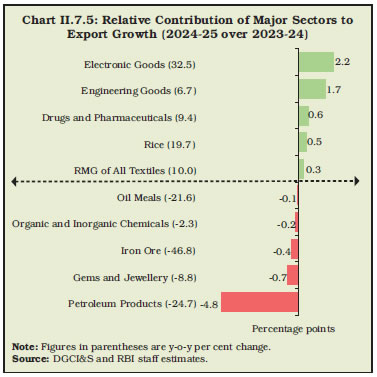
 II.7.7 Exports of engineering goods (accounting for 26.7 per cent of the total merchandise exports) increased by 6.7 per cent in 2024-25. The growth in exports of engineering goods in 2024-25 was driven by aircraft, spacecraft and parts; electric machinery and equipment; motor vehicles/cars; other miscellaneous engineering items; and auto components/parts. On the other hand, export growth was dragged down by iron and steel; aluminium and its products; copper and its products; office equipment; and mica and its products (Chart II.7.6). II.7.8 Agricultural exports rose by 6.4 per cent (y-o-y) in 2024-25 (up to February 2025). Rice exports remained robust after the phasing out of restrictions on rice exports in September and October 2024 (Chart II.7.7). On a cumulative basis, rice exports rose by 19.7 per cent (y-o-y) in 2024-25. II.7.9 Exports of electronic goods expanded by 32.5 per cent (y-o-y) in 2024-25. Mobile phones, contributing 61.7 per cent of electronic goods exports during 2024-25 (up to February 2025), rose by 54.3 per cent (y-o-y) to US$ 21.0 billion (Chart II.7.8). II.7.10 Exports of drugs and pharmaceuticals, accounting for 7.0 per cent of India’s merchandise exports, expanded by 9.4 per cent (y-o-y) in 2024-25. The growth in exports of drugs and pharmaceuticals in 2024-25 was buoyed by robust growth in exports of drug formulations and biologicals (Chart II.7.9).
II.7.11 Exports of petroleum products contracted by 24.7 per cent (y-o-y) in 2024-25 on account of easing oil prices and fall in volume (Chart II.7.10a). Among the top ten destinations for petroleum product exports, seven witnessed a fall during 2024-25 (Chart II.7.10b). II.7.12 The expansion in merchandise imports in 2024-25 was led by gold; electronic goods; and petroleum, crude oil and products. Coal, coke and briquettes; pearls, precious and semi-precious stones; and iron and steel contributed negatively to import growth (Charts II.7.11 and II.7.12). II.7.13 POL imports (25.8 per cent of total merchandise imports) grew by 3.9 per cent (y-o-y) to US$ 185.8 billion in 2024-25, underpinned by volume growth of 6.8 per cent (Chart II.7.13a). While Russia was the top source, UAE’s share in India’s crude oil imports increased during the year, and that of Iraq and Saudi Arabia moderated (Chart II.7.13b).
II.7.14 Value of gold imports rose by 27.4 per cent (y-o-y) in 2024-25 to US$ 58.0 billion, driven by higher international prices (30.0 per cent) even as total volume contracted (Chart II.7.14). II.7.15 Imports of electronic goods expanded by 12.4 per cent (y-o-y) to US$ 98.7 billion in 2024-25 (Chart II.7.15). Even as exports of electronic goods were buoyant as noted earlier, trade balance for electronic goods widened marginally to US$ 60.1 billion in 2024-25. The deficit in electronic goods was driven by deficits in electronics components; and computer hardware and peripherals; while telecom instruments recorded a trade surplus of US$ 3.7 billion (Chart II.7.16).
II.7.16 Coal imports fell by 20.0 per cent (y-o-y) in 2024-25, reflecting a decline in volume as well as lower import prices (Chart II.7.17). Higher domestic coal production and lower imports for blending purposes by thermal power plants42 led to a decline in coal imports. II.7.17 Merchandise trade deficit widened to US$ 282.8 billion in 2024-25 from US$ 241.1 billion a year ago. Oil deficit accounted for 43.3 per cent of the total trade deficit (Chart II.7.18a). Among the major trading partners, trade deficit with China, Russia and the UAE widened in 2024-25 while surpluses improved in respect of the US, the Netherlands, and the UK (Chart II.7.18b). 4. Invisibles II.7.18 Receipts pertaining to India’s invisibles – consisting of cross-border transactions in services, income, and transfers – remained buoyant during 2024-25. Net services exports at US$ 135.5 billion grew at a robust pace of 12.9 per cent (y-o-y) during April-December 2024, aided by 14.5 per cent expansion in software and business services exports (accounting for around 74 per cent of India’s services exports) [Chart II.7.19]. Amongst other services, transportation receipts increased by 19.5 per cent (y-o-y), largely driven by an increase in global freight rates due to disruptions in key trade routes – the average Baltic Dry Index43 rose by 12.0 per cent during April-December 2024 over the corresponding period of the previous year. Exports of travel services rose by 5.5 per cent (y-o-y), reflecting increased spending by tourists. Private transfer receipts, mainly representing remittances by Indians working overseas, posted a y-o-y growth of 16.2 per cent during April-December 2024. 


 II.7.19 In global commercial services trade, India retained its position among the major five exporting countries in terms of services export growth during 2024-25 (up to February 2025) [Chart II.7.20]. According to Gartner44, global IT spending is expected to rise to US$ 5.4 trillion in 2025 from US$ 5.1 trillion in 2024 which augurs well for India’s software services exports. II.7.20 India remained the top remittance recipient in 2024 (Chart II.7.21a). India’s total remittance receipts stood at US$ 137.7 billion during 2024 (on a calendar year basis). The average cost of sending remittances of US$ 200 to India is estimated at 5.3 per cent in Q3:2024, below the global average of 6.6 per cent (Chart II.7.21b). II.7.21 Net outgo in the primary income account owing to dividend and interest incomes/payments45 stood at US$ 37.3 billion during April-December 2024, higher than US$ 34.9 billion during April-December 2023. This reflects the rise in interest outgoes on liabilities such as external commercial borrowings (ECBs), external assistance and short-term credit, and payment of dividends and profits to non-resident shareholders during the same period. II.7.22 The buoyancy in net services receipts and workers’ remittances largely offset the expansion in merchandise trade deficit; accordingly, India’s CAD was contained at US$ 37.1 billion (1.3 per cent of GDP) in April-December 2024 as compared with US$ 30.7 billion (1.1 per cent of GDP) a year ago (Chart II.7.22). 5. External Financing II.7.23 The global environment for international investment continued to be challenging amidst volatile external financial conditions, heightened global economic uncertainty and prolonged geopolitical tensions. In this backdrop, net capital inflows during April-December 2024 moderated from a year ago and fell short of the CAD, thus leading to a depletion in foreign exchange reserves of US$ 13.8 billion on a BoP basis (excluding valuation effects) during April-December 2024 (Chart II.7.23 and Appendix Table 8). II.7.24 Among various capital flows, gross foreign direct investment (FDI) inflows remained resilient, rising by 13.7 per cent y-o-y to US$ 81.0 billion during 2024-25. Globally, India was placed fourth in terms of greenfield FDI capital investments announced during 2024-25 after the US, France and the UK, according to fDi Markets46. Net FDI flows at US$ 0.4 billion during 2024-25 were, however, below US$ 10.1 billion a year ago, dragged down by higher repatriation/disinvestment and net outward FDI (Table II.7.2).
II.7.25 Services sector47 accounted for a major share of FDI equity flows into India during 2024-25, followed by manufacturing, electricity and other energy, retail and wholesale trade, and transport (Appendix Table 9). Major source countries, viz., Singapore, Mauritius, the US, the Netherlands, and the UAE contributed three-fourth of the FDI flows (Chart II.7.24). | Table II.7.2: Foreign Direct Investment Flows | | (US$ billion) | | Item | 2021-22 | 2022-23 | 2023-24 | 2024-25 | | 1 | 2 | 3 | 4 | 5 | | 1. Net FDI (1.1 - 1.2) | 38.6 | 28.0 | 10.1 | 0.4 | | 1.1 Net Inward FDI (1.1.1 - 1.1.2) | 56.2 | 42.0 | 26.8 | 29.6 | | 1.1.1 Gross Inflows | 84.8 | 71.4 | 71.3 | 81.0 | | 1.1.2 Repatriation/Disinvestment | 28.6 | 29.3 | 44.5 | 51.5 | | 1.2 Net Outward FDI | 17.6 | 14.0 | 16.7 | 29.2 | | Source: RBI. | II.7.26 According to the United Nations Conference on Trade and Development (UNCTAD), India is emerging as a major source of global FDI, ranking among the top 20 source countries in 2023. Major destinations for India’s outward FDI were Singapore, the US, the UAE, Mauritius, and the Netherlands. Financial, insurance and business services, manufacturing, and wholesale, retail trade, restaurants and hotels were main sectors for India’s overseas direct investment during 2024-25. The economic size of the recipient country along with India’s bilateral merchandise exports shape India’s FDI outflows (Box II.7.1). Box II.7.1 India’s Outward FDI Trends: Insights from the Gravity Model The global FDI landscape is experiencing a structural transformation on the back of geopolitical alignments and a rising share of services in global FDI (Casella et al., 2024). EMEs are emerging as a major source of foreign investment, with the share of G20-Emerging Market (G20-EM) countries in global FDI outflows increasing from 9.7 per cent in 2009 to 16.5 per cent in 2023. In tandem with these trends, India’s outward investment has significantly increased, particularly during the post-pandemic period (Chart 1a). Also, India’s outward investment has witnessed a shift towards developed economies, with the average share rising to 51.1 per cent during 2019-2024 (Chart 1b). Macroeconomic factors such as physical distance, tax regimes, and availability of natural and strategic resources are amongst the key determinants of outward FDI flows (Cieślik et al., 2019; Kaushal, 2022). Economies also transition from being net FDI recipients to net outward investors, gaining benefits from economies of scale, enhanced competitiveness, and productivity spillovers to domestic enterprises (Herzer, 2010). To explore the determinants of outward FDI flows from India, quarterly data are used from Q1:2010 to Q1:2024 (57 quarters) for India’s bilateral outward FDI flows to 14 countries, which constitutes around 80 per cent of India’s total outward FDI. An extended gravity model is estimated by applying the Poisson Pseudo-Maximum Likelihood (PPML) estimator, given its ability to handle zero-valued observations and heteroskedasticity in the data. Following Cieślik et al. (2019) and Kaushal (2022), PPML regression is estimated as per the following generalised form:
where, ‘i’ represents the host country and ‘t’ denotes the time period. The regression results indicate that India’s outward FDI is positively impacted by the host country’s nominal GDP, emphasising the significance of market size (Table 1). Exports to the host country show a strong positive impact on outward FDI, indicating that robust bilateral trade relations strengthen economic linkages and foster investment. The negative association with distance highlights the importance of geographic and economic proximity in outbound investments. The availability of natural resources in host country boosts outward FDI bolstered by secured essential resources and stable supply chains. Further, higher corporate tax rates in host economies act as a deterrent for outward FDI. These findings emphasise the interplay of economic, geographic and institutional factors in shaping India’s outward FDI flows. | Table 1: Estimated Gravity Model Using PPML Estimator | | Dependent Variable: Log (Outward FDI) | | Explanatory Variable^ | Coefficients | | Model 1 | Model 2 | | 1 | 2 | 3 | | Log (Export) | 0.45*** | - | | | (0.04) | | | Log (Nominal GDP) | - | 0.54*** | | | | (0.05) | | Corporate Tax (in per cent) | - | -0.06*** | | | | (0.007) | | Natural Endowments (in per cent) | 0.20*** | - | | | (0.05) | | | Log (Distance) | -0.39*** | -0.39*** | | | (0.09) | (0.11) | | Number of Observations | 798 | 798 | | R-squared | 0.50 | 0.53 | ^: Physical distance is measured as geographical distance (in kilometres) between the capital cities, while natural endowments are captured by percentage share of raw material export in total export of the host country.
-: Not Applicable.
*** represents significance level at 1 per cent.
Note: Figures in parentheses indicate robust standard errors.
Source: RBI staff estimates. | References: 1. Casella, B., Bolwijn, R., and Casalena, F. (2024), ‘Global Economic Fracturing and Shifting Investment Patterns: A Diagnostic of Ten FDI Trends and Their Development Implications’. Vox EU, Centre for Economic Policy Research. 2. Cieślik, A., and Tran, G. H. (2019), ‘Determinants of Outward FDI from Emerging Economies’, Quarterly Journal of Economics and Economic Policy, 14(2), 209-231. 3. Herzer, D. (2010), 'Outward FDI and Economic Growth', Journal of Economic Studies, 37(5). 4. Kaushal, L. A. (2022), ‘Institutional and Economic Determinants of Indian OFDI’, Cogent Economics & Finance, 10(1), 2147648. | II.7.27 During 2024-25, foreign portfolio investment (FPI) registered a net inflow amounting to US$ 1.7 billion as compared to net inflows of US$ 41.6 billion during the previous year (Chart II.7.25). The debt segment witnessed steady FPI inflows amounting to US$ 17.4 billion on the back of inclusion of Indian sovereign bonds in global bond indices. Equity FPI flows, however, recorded net outflows of US$ 15.7 billion during the same period as against net inflows of US$ 25.3 billion in 2023-24, mirroring trends in other EMEs with rising risk-off sentiments leading to selloffs in the equity segment during April-May 2024, October-November 2024 and January-February 2025. FPI equity outflows were largely contributed by oil, gas and consumable fuels, fast moving consumer goods, automobile, and power sectors, while inflows were primarily recorded in the financial services, telecommunication, healthcare, and consumer services sectors. Even as investment by FPIs in the debt market increased, the utilisation remains below the available investment limits. As at end-March 2025, 15.7 per cent of the limits in central government securities (G-secs) were utilised (18.5 per cent as at end-March 2024). Of the total value of specified central G-secs opened for non-resident investors under the fully accessible route (FAR), 7.1 per cent were held by FPIs as at end-March 2025, up from 4.5 per cent as at end-March 2024. 
 II.7.28 During 2024-25, net ECB inflows to India rose significantly to US$ 18.7 billion from US$ 3.6 billion in 2023-24 (Chart II.7.26). Besides on-lending/sub-lending, disbursements were used for refinancing of earlier ECBs, new projects and working capital requirements (Chart II.7.27). The share of rupee denominated loans and bonds in the total agreement amount stood at 5.0 per cent during 2024-25 as compared with 5.3 per cent a year ago. Of the total ECB agreement amount during 2024-25, 67.6 per cent was explicitly hedged, 5.2 per cent was from FDI parent companies (excluding INR loans) and 5.0 per cent was denominated in the INR. The remaining 22.3 per cent comprised other ECBs, including naturally hedged loans (i.e., borrowers’ business earnings in foreign currency). 
| Table II.7.3: Flows under Non-Resident Deposit Accounts | | (US$ billion) | | Item | 2021-22 | 2022-23 | 2023-24 | 2024-25 | | 1 | 2 | 3 | 4 | 5 | | 1. Non-Resident External (Rupee) Account | 3.3 | 2.5 | 4.2 | 4.7 | | 2. Non-Resident Ordinary Account | 3.5 | 4.0 | 4.2 | 4.4 | | 3. Foreign Currency Non-Resident (B) Account | -3.6 | 2.4 | 6.4 | 7.1 | | Non-Resident Deposits (1+2+3) | 3.2 | 9.0 | 14.7 | 16.2 | | Source: RBI. | II.7.29 Short-term trade credit increased during April-December 2024 in line with the rise in merchandise imports, with a net inflow of US$ 11.1 billion as compared with a net outflow of US$ 1.0 billion during the corresponding period a year ago. Around 32 per cent of the trade credit was raised for imports of crude oil, gold, coal and copper. Net inflows under non-resident deposits increased to US$ 16.2 billion during 2024-25 from US$ 14.7 billion a year ago (Table II.7.3). 6. Vulnerability Indicators II.7.30 India’s external debt to GDP ratio remained modest at 19.1 per cent as at end-December 2024 (18.5 per cent as at end-March 2024), the lowest among emerging market peers (Table II.7.4). The share of short-term debt (residual maturity) in total external debt declined to 42.4 per cent as at end-December 2024. Foreign exchange reserves continue to provide a strong buffer for mitigating external risks and spillovers. As at end-December 2024, foreign exchange reserves were more than two times of short-term external debt (residual maturity). Moreover, foreign exchange reserves as at end-March 2025 provided a cover of 11 months of merchandise imports (on BoP basis) for 2024-25. Net international investment position (IIP) to GDP ratio also recorded an improvement as at end-December 2024. | Table II.7.4: External Vulnerability Indicators (End-March) | | (Per cent, unless indicated otherwise) | | Indicator | 2013 | 2022 | 2023 | 2024 | End-December 2024 | | 1 | 2 | 3 | 4 | 5 | 6 | | 1. External Debt to GDP Ratio | 22.4 | 19.9 | 19.1 | 18.5 | 19.1 | | 2. Ratio of Short-term Debt (Original Maturity) to Total Debt | 23.6 | 19.7 | 20.6 | 19.1 | 19.4 | | 3. Ratio of Short-term Debt (Residual Maturity) to Total Debt | 42.1 | 43.2 | 44.0 | 43.4 | 42.4 | | 4. Ratio of Concessional Debt to Total Debt | 11.1 | 8.3 | 8.2 | 7.4 | 6.8 | | 5. Ratio of Reserves to Total Debt | 71.3 | 98.1 | 92.7 | 96.7 | 88.6 | | 6. Ratio of Short-term Debt (Original Maturity) to Reserves | 33.1 | 20.0 | 22.2 | 19.7 | 22.0 | | 7. Ratio of Short-term Debt (Residual Maturity) to Reserves | 59.0 | 44.0 | 47.4 | 44.9 | 47.8 | | 8. Reserve Cover of Imports (in Months)* | 7.0 | 11.8 | 9.6 | 11.3 | 10.5 | | 9. Debt Service Ratio (Debt Service to Current Receipts) | 5.9 | 5.2 | 5.3 | 6.7 | 6.6 | | 10. External Debt (US$ billion) | 409.4 | 618.8 | 623.9 | 668.8 | 717.9 | | 11. Net International Investment Position (NIIP) [US$ billion] | -326.7 | -358.1 | -367.1 | -361.2 | -364.5 | | 12. NIIP/GDP Ratio | -17.8 | -11.6 | -11.3 | -10.1 | -9.8 | | 13. CAB/GDP Ratio | -4.8 | -1.2 | -2.0 | -0.7 | -1.3 | *: Based on merchandise imports of latest four quarters, published in BoP statistics.
Source: RBI and Government of India. | 7. Conclusion II.7.31 India’s external sector displayed resilience in the face of global challenges. Supported by sustained robust growth in services exports and private transfer receipts, current account deficit remained manageable despite a widening merchandise trade deficit. Even as portfolio capital flows exhibited volatility, strong buffers in the form of ample foreign exchange reserves and modest external debt liabilities impart strength to the external sector, contributing to overall macroeconomic and financial stability.
Index |