By Lokesh and A R Jayaraman^ Inbound tourism in India is emerging as one of the key drivers of economic growth. In this article, an attempt has been made to explore the potential of destination insights with google (DIG), an alternate data source, to track inbound tourism, which is a novel attempt in the Indian context. This study shows: i) there is a strong association between foreign tourist arrivals (FTA) and the travel related search index extracted from DIG, ii) the index is able to capture the directional changes in FTA reasonably well, and iii) the index Granger causes FTA, which implies its ability to predict FTA. Therefore, this index can be used as a leading indicator for tracking FTA. Introduction Tourism is one of the largest global economic sectors experiencing continued growth and diversification across the world. It has become a major player in international commerce and a primary source of income for many developing countries, significantly contributing to their gross domestic product (GDP). India’s cultural diversity is one of its biggest draws of tourism. Each state has its unique traditions, festivals, and cuisines, offering a wide array of experiences for tourists. From the vibrant festivals of Rajasthan to the serene backwaters of Kerala, the spiritual temples of Varanasi to the bustling streets of Mumbai, there is something for everyone. Also, niche tourism products, such as adventure tourism1, medical and wellness tourism2, and eco-tourism, increasingly attracting the attention of international travelers to India. As like other economies, inbound tourism plays an important role in India also, for the economic growth. As per Ministry of Statistics and Programme Implementation (MoSPI), Government of India (GoI), trade, hotels, transport, communication and services related to broadcasting have contributed about 19 per cent to overall Gross value added (GVA) at basic prices in 2023-24. Recently, inbound tourism has been increasing in India, gaining researchers’ interest to monitor tourism sector closely. The economic and social benefits of tourism are manifold. First, it directly creates employment in sectors like hospitality, transport, and entertainment. Second, it indirectly generates jobs in associated sectors that supply goods and services for the tourism industry. Third, tourism stimulates the infrastructure development such as roads, airports, and hotels, benefiting the local community beyond the tourism sector. Fourth, preservation of heritage sites and promotion of local arts and crafts can act as a catalyst to develop even less or under-developed areas in a region by attracting tourists. This will not only stimulate the regional economic activity, but also would help to reduce regional disparities and contribute to social equity. Fifth, tourism boosts the local economy through foreign exchange receipts, thereby strengthens the local currency and improves the standard of living. Lastly, tourism not only has a direct impact on the economy but also plays a crucial role in fostering international relations. As inbound tourism significantly contributes to the economy, tracking of foreign tourist arrivals (FTA) in near real-time is of interest to business entities and policymakers. Empirical studies suggest that there is a direct link between web searches and the tourism industry. In this article, an attempt has been made to explore a non-traditional high-frequency data source, viz., Destination Insights with Google (DIG) to monitor inbound tourism in India by examining the relationship between google searches made for travelling to India from rest of the world and FTA. For this study, the data is collected from three sources: (i) monthly FTA data from the Ministry of Tourism, Government of India for the period January 2021 to June 2024, (ii) quarterly GVA - Trade, Hotels, Transport, Communication and Services related to Broadcasting (GVA-THTCB) from MoSPI for Q4:2020-21 to Q4:2023-24, and (iii) daily data on google search volume index (GSVI) from DIG for India from January 2021 to June 2024. Rest of the article is organised as follows: In Section II, a brief description about tourism in India is presented and Section III discusses the literature review. Section IV explains DIG and data used for the study. Empirical analysis is presented in Section V and the conclusion in Section VI. II. Tourism in India India has taken several initiatives to boost tourism such as: i) introduction of e-visa facilities for over 150 countries, ii) showcasing India’s rich heritage and diverse culture to the world through ‘Incredible India’ campaign, iii) Swadesh Darshan Scheme focusing on developing theme-based tourist circuits, iv) Pilgrimage Rejuvenation and Spiritual, Heritage Augmentation Drive (PRASHAD) Scheme focusing on the development and beautification of pilgrimage sites. Significant improvements in infrastructure have also contributed to the growth of tourism. The development of world-class airports, better road connectivity, and the introduction of luxury trains like the ‘Palace on Wheels’ and ‘Maharajas’ Express’ have made traveling in India a more comfortable experience. In 2015-16, an international passenger survey (IPS) was conducted to get insights into the profile, preferences, and expenditure patterns of foreign tourists visiting India. This survey covered various aspects, including purpose of visit, mode of travel, duration of stay, places visited, activities undertaken, feedback on tourism facilities etc. Over half of the respondents (51.6 per cent) who participated in the survey have visited India either for vacation, or leisure, or recreational activities. Survey findings also highlight that “friendly-people”, and “Indian-culture” have impressed the visitors the most. Foreign tourists visit to India, which was above 10 lakhs in first two months of the year 2020, dipped sharply after March 2020 due to Covid-19 pandemic restrictions. Inbound travel to India again gained momentum since November 2021 and there has been a significant increase in the number of foreign tourists visiting India in 2023 compared to previous years. The year 2023 was promising for the tourism sector, propelled by the G20 Summit, meetings, incentives, conferences, and exhibitions (MICE) events, leisure trips, and the return of business travelers. Additionally, ICC Cricket World Cup in India also fueled India’s tourism boom. Similar trend is seen in first half of 2024 (Chart 1). 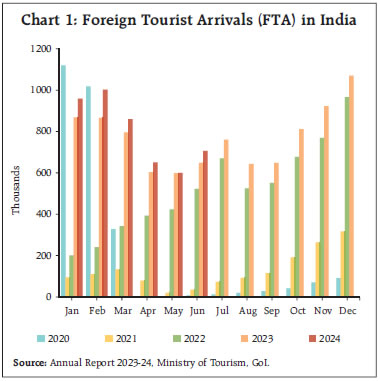
 Travel and tourism have created 76.17 million jobs in 2022-23, both direct and indirect, which is 12.57 per cent of total jobs created during the same period (Chart 2). Furthermore, there exists a significant correlation between FTA and GVA-THTCB for Q4:2020- 21 to Q4:2023-24 (0.71), which supports the earlier argument that FTAs contribute directly and indirectly to GVA (Chart 3). Foreign exchange earnings from the tourism industry for 2023 reached ₹2.32 lakh crores, marking an increase of over 66 per cent compared to 2022. III. Literature Review The dominant role of tourism in accelerating economic growth is widely discussed in the literature and studies have found that there exists a unidirectional causality from tourism earnings to economic growth (Sharma, 2018). Dash et al., (2018) have found that there is a positive impact of tourists on economic growth in India both in short-run and long-run. Tourism has emerged as the world’s third-largest export industry after fuels and chemicals, surpassing food and automotive products. In recent years, international tourism has surged, accounting for 6 per cent of the world’s total exports and 24 per cent of the services exports in 2023. Rasool et al., (2021) has examined the relationship between inbound tourism, financial development, and economic growth using panel data from 1995 to 2015 for the BRICS countries (Brazil, Russia, India, China, and South Africa). The panel ARDL cointegration test results indicate a long-term cointegration among tourism, financial development, and economic growth. Additionally, Granger causality analysis reveals a bi-directional causality between inbound tourism and economic growth.  Internet has become one of the starting points for travel related information searches and has a significant share in overall online searches (Fesenmaier et al., 2011; and Jansen et al., 2008). These searches include information related to geographical locations, such as city, region, country names, etc., which make up nearly 60 per cent of total queries. Travel related searches using city or country name show the interest of people to visit such destinations, and they may become potential visitors to those destinations in near future. Among the major internet search engines, Google is the most popular search engine that accounts for 90 per cent of market share (Salehi et al., 2018). Moreover, Google searches could serve as a valuable resource for predicting tourism demand which is both timely and cost-effective (Önder and Gunter, 2016). The application of big data in forecasting daily tourism demand has been explored by researchers using search volumes along with other variables including historical tourist volumes, daily weather conditions, and public holiday dates. Google Trends data has been explored by many researchers to track tourism demand. Some of these studies have employed customer journey theory3 to derive search query terms deductively and found that Google Trends holds value for forecasting tourism. They also found that Google Trends data and tourism statistics have similar patterns, especially during disasters. Furthermore, Google Trends data has a significant correlation with official data and produces accurate predictions of tourism demand in Indonesia. Thus, use of Google Trends for tourism demand forecasting is a valuable option both for cities and countries as per literature (Hasyyati et al., 2022; Rödel, 2017; and Önder, Irem, 2017). Inclusion of Google searches for forecasting arrivals improves the predictability and this improvement is particularly significant when searches are made in the native language (Önder and Gunter, 2016). Bi et al., (2022) introduced crucial yet another complex task of accurately predicting daily tourism demand. They used an ensemble of long short-term memory (LSTM) networks to forecast daily tourism demand, which is designed to automatically capture the relationship between these forecasting variables and the actual tourism demand. IV. Destination Insights with Google (DIG) Destination Insights with Google is an online platform designed by google and it is different from Google Trends. DIG is designed specifically for tracking tourism industry across the world; the data available on this platform provides index based on search keywords related to tourism industry only. In contrast, index available on Google Trends is based on a set of customised search keywords provided by the user. DIG platform provides insights related to travel destinations, top countries from where travel demand is arising and top tourist attractions in a country based on searches made by the potential tourists from rest of the world. Also, it helps to understand how the demand for a specific tourist destination has shifted over the time. Further, this platform provides the Top Rising Destinations in a country in terms of growth in consumer search interest based on selection criteria of filters and date range. The Google Search Volume Index (GSVI) of DIG provides interest of international and domestic travelers to visit various destinations in a country. The index (GSVI-DIG) ranges between 0 and 100, where 100 indicates the highest relative search interest for travel to a particular destination during a specific period, compared to other times. The value is normalised and does not represent the absolute number of searches. While using the search volume index to predict FTA, one may come across two types of bias, viz., i) language bias and ii) platform bias. Suppose the search volume index is attributed to queries based on English alone, then there is a possibility of neglecting queries made in other languages. Also, if the users of search engines use rare language for voice search, there is a chance that Google may not retrieve data for such queries. Thus, the above issues may cause language bias in search volume data. It is also possible that people may use different search engines for making travel related queries. However, GSVI-DIG represents the search queries made only on Google search engine, which may lead to platform bias (Theologos Dergiades, et al., 2018). As Google search engine holds the highest market share, therefore GSVI-DIG provides a reasonably good representation of travel search queries across the globe. V. Empirical Analysis A comprehensive analysis on GSVI-DIG data has been performed to identify the originating countries of the travelers who have shown interest to visit India and the destinations selected in India. This analysis throws light on destinations which gained tourist interest over a period of time. Google has ranked countries and cities based on country and city indices4 derived from volume of consumer search interest. In 2023, tourists from countries such as United Arab Emirates, United States, Canada, United Kingdom, Saudi Arabia and Australia have shown significant interest to visit India; the top five destinations for these tourists were New Delhi, Mumbai, Chennai, Hyderabad, Bengaluru and Kochi (Chart 4a and 4b).
FTA and GSVI-DIG, exhibit significant comovement suggesting that GSVI-DIG can be used for tracking FTA (Chart 5). The GSVI-DIG index continued to remain above 50 since February 2022 and its rising trend indicates increasing foreign tourist interest in India. Cross-correlation Analysis To examine the relationship between FTA and GSVI-DIG, a cross-correlation analysis has been carried out. For analysis purpose, natural log values of FTA and GSVI-DIG have been considered subsequently. As web searches or queries might have happened well in advance before the actual visit to India, correlation between FTA and first ten lags of GSVI-DIG have been examined. There is a strong and statistically significant correlation, at 1 per cent level of significance, between FTA and lagged values of GSVI-DIG (up to 5 lags), with the correlation declining sharply for subsequent lags (Table 1 and Chart 6). This suggests that people who search for Indian destination today may have a higher likelihood of visiting India in the coming months and very highly likely that tourists would visit India in the first two months. | Table 1: Cross-correlation between FTA and GSVI | | Lag of GSVI | Correlation | Lag of GSVI | Correlation | | Lag 0 | 0.92*** | Lag 6 | 0.38** | | Lag 1 | 0.91*** | Lag 7 | 0.32 | | Lag 2 | 0.79*** | Lag 8 | 0.29 | | Lag 3 | 0.69*** | Lag 9 | 0.24 | | Lag 4 | 0.60*** | Lag 10 | 0.16 | | Lag 5 | 0.48*** | | | Note: *** and ** represent statistical significance at 1 per cent and 5 per cent level, respectively.
Source: Authors’ estimate. |
Causality Analysis The Granger Causality test is widely used in the literature to check if the observed relationship between two variables can be used to generate predictions. The underlying hypothesis is that lagged values of variable explain the variation in another variable and vice-versa. As FTA and GSVI-DIG show a strong association, Granger-Causality test has been used to check the presence of such a relationship between these two variables. The presence of unit root in both variable, FTA and GSVI-DIG, have been tested before performing the Granger-Causality test, in order to ensure that variables are stationary. Augmented Dickey-Fuller (ADF) test and Kwiatkowski–Phillips–Schmidt–Shin (KPSS) test are used to test the stationarity. The unit root tests suggest that both the variables are non-stationary. Therefore, first difference of both the variables have been taken to make them stationary and subsequently causality analysis has been performed. Results of Granger causality point out bidirectional causality between GSVI-DIG and FTA (Table 2). Therefore, from the results of Granger Causality, it can be concluded that FTA, besides its own lags, is also influenced by GSVI-DIG, and vice-versa. Thus, the GSVI-DIG has significant explanatory power to predict FTA and it can be used as a leading indicator for tracking FTA in India in near real-time. | Table 2: Granger Causality Test Results | | | F-statistic | | ΔL(GSVI-DIG) does not Granger Cause ΔL(FTA) | 6.75*** | | ΔL(FTA) does not Granger Cause ΔL(GSVI-DIG) | 3.74** | Notes: 1. ΔL represents the log difference transformation.
2. *** and ** represent statistical significance at 1 per cent and 5 per cent level, respectively.
Source: Authors’ estimate. | Directional Analysis Directional analysis has been carried out to evaluate the tracking performance of GSVI-DIG to capture the trajectory of FTA over a period of time. To examine whether FTA and GSVI-DIG are moving in tandem, directional accuracy between these two variables have been examined: (i) at levels, and (ii) y-o-y change. The directional accuracy is measured in terms of proportion of times both FTA and GSVI moved in the same direction. For FTA, one-period change is defined as below: Directional change in GSVI is defined as follows: Accordingly, a 2×2 contingency table is constructed as below (Table 3): Where, N = A+B+C+D Further, Fisher’s Exact (FE) test has been performed to test the null hypothesis that the direction of change in FTA and direction of change in GSVI are independent, both at levels and y-o-y growth. Rejection of null hypothesis implies that GSVI is able to capture the directional change in FTA, or vice-versa. Results summarised in Table 4 show a high directional accuracy between: (i) FTA and GSVI-DIG, and (ii) y-o-y change in FTA and GSVI-DIG. With directional accuracy of 72 per cent at y-o-y level, the GSVI-DIG appears to capture the directional change in FTA reasonably well (Table 4). | Table 3: Contingency Table | | Number of periods | Yt | | 0 | 1 | | Zt | 0 | A | B | | 1 | C | D |
| Table 4: Directional Accuracy between FTA and GSVI | | Variables | Number of observations | Accuracy
(per cent) | | At levels | 41 | 59 | | Y-o-y change | 29 | 72** | Note: ** represent statistical signifiacnce at 5 per cent level
Source: Authors’ estimate. | VI. Conclusion Tracking trends in tourism industry is of interest to policy makers as it contributes to the economic growth. Many researchers have used Google Trends data to predict the tourism demand. This study uses Destination Insights with Google, a non-traditional data source, to track the inbound tourism in India in near real-time. Empirical results show a strong correlation between FTA for the current month and travel search volume index for preceding five months. Results also suggest that the index is able to capture the directional changes in FTA reasonably well. Further, the Granger Causality test indicates that the search volume index has ability to predict FTA and therefore can be used as a leading indicator for tracking FTA. References: Bi, J. W., Li, C., Xu, H., and Li, H. (2022). Forecasting Daily Tourism Demand for Tourist Attractions with Big Data: An Ensemble Deep Learning Method. Journal of Travel Research, 61(8), 1719-1737. Dash, A. K., Tiwari, A. K., and Singh, P. K. (2018). Tourism and Economic Growth in India: An Empirical Analysis. Indian Journal of Economics, 392(99), 29-49. Fesenmaier, D. R., Xiang, Z., Pan, B., and Law, R. (2011). A Framework of Search Engine Use for Travel Planning. Journal of Travel Research, 50(6), 587-601. Hasyyati, A. N., Indriani, R., and Lestari, T. K. (2022). Predicting Tourism Demand in Indonesia using Google Trends Data. Retrieved from Http://Arxiv.Org/Abs/2211.13938. Jansen, B. J., Ciamacca, C. C., and Spink, A. (2008). An Analysis of Travel Information Searching on the Web. Information Technology and Tourism, 10(2), 101-118. Önder, I., and Gunter, U. (2016). Forecasting Tourism Demand with Google Trends for a Major European City Destination. Tourism Analysis, 21(2-3), 203-220. Önder, I. (2017). Forecasting Tourism Demand with Google Trends: Accuracy Comparison of Countries versus Cities. International Journal of Tourism Research, 19(6), 648-660. Rasool, H., Maqbool, S., and Tarique, M. (2021). The Relationship Between Tourism and Economic Growth Among BRICS Countries: A Panel Cointegration Analysis. Future Business Journal, 7(1), 1. Rödel, E. L. (2017). Forecasting Tourism Demand in Amsterdam with Google Trends: A Research into The Forecasting Potential of Google Trends for Tourism Demand in Amsterdam (Master’s Thesis, University Of Twente). Salehi, S., Du, J. T., and Ashman, H. (2018). Use of Web Search Engines and Personalisation in Information Searching for Educational Purposes. Information Research: An International Electronic Journal, 23(2). Sharma, N. (2018). Tourism Led Growth Hypothesis: Empirical Evidence from India. African Journal of Hospitality, Tourism and Leisure, 7(2), 1-11.
|