by Nishant Singh and Love Kumar Shandilya^ Vegetable prices exhibit large volatility and are generally a major contributor to India’s food and headline inflation. This volatility is often exacerbated by supply-side disturbances, predominantly driven by weather shocks, warranting a regular and careful track of evolving weather conditions. This study investigates how weather anomalies, particularly in rainfall and temperature, affect vegetable prices in India. Empirical results suggest that weather anomalies affect vegetable prices, with temperature anomalies having a more immediate impact. Moreover, the impact of temperature anomalies has increased in recent periods, highlighting the need for faster adoption of temperature-resistant crop varieties to support price stability. Introduction Under a flexible inflation targeting (FIT) framework, accurate inflation forecasts are essential for guiding monetary policy actions and anchoring inflation expectations. The accuracy of inflation forecasts requires a regular and careful tracking of food price movements in India as the food and beverages group has a high weight (45.86 per cent) in India’s Consumer Price Index (CPI). Food prices also demonstrate high volatility often induced by supply shocks, which can potentially influence inflation expectations. The movements in food prices also impact the welfare of the poor (Sekhar, et al., 2018) and developments concerning food security (Cachia, 2014). After a significant moderation since 2014, CPI-food inflation1 witnessed an uptick in both mean and volatility starting 2019-20 due to return of supply disturbances majorly driven by weather shocks, the COVID-19 pandemic and geopolitical tensions. In India, food supply is often affected by adverse weather events. The major driver of food price volatility is vegetable prices2, which are perishable and highly dependent on the weather conditions in India. Weather developments, such as rainfall and temperature conditions, are crucial for vegetables production and their domestic availability (Economic Survey 2024-25) as (1) most of the production in India, the second largest producer of vegetables and fruits in the world3, comes from small and marginal farmers with very little or no safeguard against such disturbances, and (2) farmers generally base their agricultural decisions on normal conditions of weather, including rainfall and temperature, as well as prevailing market prices, while deviations from these normal conditions can affect crops, leading to price fluctuations. Such price changes and volatility can potentially cause imbalances to production cycles and price divergence among alternative substitutable crops. While this often prompts farmers to adjust their decision-making for subsequent cropping seasons by altering their crop choices, consumers also sometimes go for some demand substitution, thereby intensifying the cobweb phenomenon. This underscores the need for a careful monitoring of weather conditions and prices as disturbances in them can adversely impact agricultural outcomes. The rising occurrence of adverse weather events, such as large deviations in rainfall and temperature, calls for an increased attention towards tracking them and evaluating their impact on food prices, especially the prices of vegetables which add substantially to the overall food price volatility in India. Therefore, this study attempts to empirically investigate the impact of weather anomalies, i.e., deviation in rainfall and temperature from their normal4 levels, on vegetable prices in India for the 10-year period i.e., April 2014 – March 2024. II. Food Inflation and Weather Patterns in India - Stylised Facts Food and Vegetables Inflation in India Food and non-food (CPI-excluding food) inflation averaged at 5.1 per cent during April 2014-March 2024 in India, resembling the headline inflation (Table 1). A similar picture emerges even within the food group across CPI-vegetables and CPI-food excluding vegetables. While they record a narrow divergence in their respective mean inflation, their inflation volatility5 differ substantially. CPI-food inflation exhibits a higher volatility than the non-food group. Similarly, within the food group, vegetable inflation demonstrated considerably higher volatility compared to food excluding vegetable inflation. | Table 1: Inflation in India - Summary Statistics | | Period: April 2014 – March 2024 | | Measure | Weight in CPI | Mean | Standard Deviation | | CPI-Headline | 100 | 5.1 | 1.5 | | CPI-Food | 45.86 | 5.1 | 3.0 | | CPI-Excluding Food | 54.14 | 5.1 | 1.1 | | CPI-Vegetables | 6.04 | 4.9 | 14.8 | | CPI-Food Excluding Vegetables | 39.82 | 5.2 | 2.3 | | Sources: National Statistics Office (NSO), Ministry of Statistics and Programme Implementation (MoSPI), Government of India (GoI); and RBI staff estimates. | Given the high weight of the food and beverages group in CPI and its large price volatility, food inflation contributed significantly to the headline inflation, driving its peaks and troughs during 2014-2024 (Chart 1a and 1c). Similarly, movements in vegetables inflation significantly influenced food inflation due to its large volatility and weight (Chart 1b and 1d). After easing since 2014 on improved supply conditions, food inflation increased sharply in 2019-20 on excess rain-induced spike in vegetable prices (RBI, 2020), followed by pandemic-driven supply disruptions in 2020-21 (RBI, 2021). After moderating in 2021-22 on ebbing of global supply chain disruptions, food inflation increased again as a result of unleashed pent-up demand, followed by the geopolitical conflict in Europe, which led to a return of pressures in global food and energy prices (IMF, 2022). As the adverse effects of the pandemic and the conflict appeared to subside and food prices began to normalise, weather-related disturbances in the form of erratic rainfall and higher temperatures led to supply disturbances and renewed shocks to food prices, especially vegetables, which kept food inflation elevated during 2023-2024. Therefore, weather disturbances have been one of the major factors which led to higher volatility in food, especially the vegetables inflation after 2019 (Chart 1c and 1d). Vegetables Supply and Weather Anomalies in India Vegetables are grown majorly across all seasons, with alternative crops having a different frequency of sowing and production cycle across geographical regions. While most crops have a production cycle of around 2-4 months from sowing to harvesting, a few are exceptions, viz., garlic, ginger and lemon, among others (Table A1). In terms of frequency of sowing, brinjal, palak and other leafy vegetables are generally grown throughout the year except for monsoon months. While tomato, onion and potato (TOP) are grown during both Kharif and Rabi seasons, latter contributes most to their production. Some other crops, such as cauliflower, cabbage, okra and carrot are grown both in the Rabi and summer seasons. On the other hand, vegetables such as green chillies, cucumber, bottle gourd and bitter gourd are majorly Kharif-grown crops. However, due to the varietal improvement (development of heat and drought-tolerant early maturing varieties), some vegetables are now grown in non-traditional areas and other seasons as well. While Kharif crops are more impacted by unseasonal rains due to their occurrence around the monsoon season (RBI, 2023b), Rabi and summer crops are more susceptible to temperature fluctuations. Nevertheless, weather anomalies affect the crops at different stages of growth (Rashid et al., 2020). The resulting movements in production along with other supply-side factors affect market arrivals and drive short-term price movements.  India witnessed multiple episodes of weather shocks which have induced extreme vegetable price movements in the past decade. While large anomalies in rainfall across regions have become more frequent, the incidence of above-normal temperatures has also increased over time in India (Chart 2a, 2b, and 2c). Heatwave episodes during 2015-2016 and 2022 negatively impacted some vegetable crops. In 2022, however, the impact was subdued owing to better reservoir storage and rainfall conditions that year (Bal et al., 2022). Intense heatwaves during April-June 20246 have also adversely affected some vegetable crops in India. Cold waves, though less frequent than heatwaves, also affected vegetable crops in recent past, especially during the 2023-24 winter season in some parts of northern India. Nonetheless, the anomalies in rainfall and temperature reflect the intensity of extreme weather events such as cyclones (Singh et al., 2012), heatwaves and cold waves, which adversely affect vegetable crops and their prices.  There are numerous instances in India where weather disturbances have led to sharp price pressures in vegetables. One of the extreme weather disturbances occurred in 2019-20 when India witnessed excess and unseasonal rains during winter months, leading to crop losses and supply disruptions in vegetables, especially onion, which resulted in sharp price pressures and an overall increase in vegetables inflation (RBI, 2020) [Chart 2b, 3a and 3b]. Inflationary pressures were witnessed in potato also in 2020 due to crop loss and supply disruptions in West Bengal, Uttar Pradesh and Punjab on cyclonic disturbances, excess rains, and higher temperatures. In another event in 2023-24, excess rains across regions in India in July (Chart 2b), adversely affected vegetable crops, especially tomato, again leading to higher vegetables inflation (RBI, 2023a). Similar price pressures in tomato were witnessed in July 2017, also induced by adverse weather conditions (RBI, 2017). The weather disturbances in 2023-24 including excess rains and higher temperatures led to crop damage in garlic also, which witnessed high inflation during the second half of the year. Furthermore, 2023-24 was an El Nino year characterised by below-normal rainfall and lower reservoir levels with higher temperatures7, which severely affected vegetable yields, and resultantly, a fall in vegetable production was observed for the first time in a decade (Chart 3a).  Price movements in vegetables are highly affected by the quantum of market arrivals, which are not only impacted by production but also by several other factors, including speculative activities by market players, foreign trade policies and government intervention (Madaan, 2019). During the initial onset of the pandemic and supply chain disruptions on account of nationwide lockdown, market arrivals declined, leading to sharp price pressures in vegetables (Chart 3b). III. Literature Review The impact of weather anomalies on agricultural output and food prices has been discussed by several studies around the world. The regular assessment of such impact has high importance for countries like India, where the share of food items in CPI is significant. Available literature suggests that weather anomalies, including changes in rainfall and temperature patterns, potentially influence agricultural production and yields as well as food prices across countries. Using data on local market food prices across 51 countries in the developing world during 2008-2012, Brown and Kshirsagar (2015) find that local market food prices are affected by domestic weather disturbances in the short run. Odongo et al. (2022), using climate data from African Countries, find that the amount of rainfall is one of the major determinants of food inflation. According to Lesk et al. (2016), over the period 1964-2007, extreme heat events significantly damaged agricultural production across the globe. Adam et al. (2012) suggests that food price inflation is predominantly driven by rainfall deviations from its long-run pattern. Using monthly panel data from India on wholesale food prices from 2004 to 2017, Letta et al. (2022) find that drought conditions substantially increase food prices during the crop growth, even before any harvest loss has materialised. Furuya and Kobayashi. (2009) also argue that rising temperatures have a remarkable influence on crop production and varying impact on yields for different crops in different countries or regions. The impact of weather anomalies, more particularly on vegetables, is also discussed in literature. According to Rashid et al. (2020), vegetable crops are highly sensitive to climatic irregularities like changing temperature and precipitation at any phase of crop growth, which can adversely impact crop yield, its quality, and increase risk of pest and disease problems. Yang et al. (2022) find that prices of some vegetable varieties are affected by changes in temperature and precipitation in China. Using Mexican data, Gonzalez et al. (2023) find that vegetable prices are sensitive to temperature shocks that occur during the growing period and carry detrimental effects on vegetable yields. Using data from the Czech Republic for 1961-2014, Potopová et al. (2017) also find that key adverse weather events like heavy rainfall, drought and heat stress affect the vegetable crop yields. Alongside global literature, several Indian studies are also available in this area. Analyzing major weather-related events in India since 1901, Dilip and Kundu (2020) show that incidence of extreme weather events has increased in the last two decades, with rising temperature levels and volatile precipitation, and finds that the macroeconomic impact of climate change on food inflation has been statistically significant. Ghosh et al. (2021) also suggest that natural calamities or extreme weather events impact agricultural yields and food inflation. According to the Economic Survey 2024-25, vegetables are more vulnerable to extreme weather events, like cyclones, heavy rains. thunderstorms, hailstorms, and droughts, which can temporarily affect their prices. Madaan et al. (2019) suggest that events of weather disturbances may cause damage to some vegetable crops and such events are often leveraged by traders who exaggerate the problems by hoarding to push-up the prices. Using cross-country data, Venkat and Masters (2022) also find that vegetables are impacted by extreme weather events. While several studies are limited primarily to discussing the impact of specific extreme weather events on food production and inflation using correlations, causality tests, and dummy analysis due to data limitations, research studying the impact of weather anomalies (which not only reflect extreme weather events but also the recurring deviations from normal weather pattern), focusing specifically on vegetable prices, using multivariate modelling framework remains scarce. Therefore, this study adds to the existing literature by investigating the impact of anomalies in rainfall and temperature levels on vegetable prices in India under a formal multivariate modelling framework and discussing how their impact has changed over time. IV. Methodology and Empirical Framework The study investigates the impact of weather anomalies, captured by deviation in rainfall and temperature from their normal levels or long period averages (LPA), on vegetable prices in India for the 10-year period i.e., April 2014 – March 2024. For the impact assessment exercise, movements in market arrivals and reservoir levels are controlled for to carve-out the true and short-term impact of weather anomalies on vegetable prices (Table A2). As market arrivals are not only impacted by production but several other factors also, including speculative activities by market players, foreign trade policies and government intervention, they are used to control for the impact of factors other than the weather shocks driving vegetable price movements. Given that the sowing area of vegetables under irrigation is large, the gradual movements in reservoir levels have importance for understanding the impact of weather anomalies on vegetables. While the persistent nature of lower reservoir levels can adversely impact irrigation activities and crop growing process, which can affect yields and drive higher price expectations even in absence of short-term weather anomalies, higher reservoir levels can soften the adverse impact of short-term weather anomalies to some extent. Therefore, controlling for the persistent impact of reservoir levels can help in highlighting or carving-out the immediate impact of rainfall and temperature anomalies. Given the inherent non-stationarity in CPI-vegetables inflation (y-o-y) and to capture short-term movements, CPI-vegetables momentum8 has been used as the target variable for the empirical exercise (Table A3). While the vegetable prices and arrivals are used in the momentum form, weather-related variables like rainfall, temperature, and reservoir level are used in deviation from normal9. Seasonally adjusted data on CPI-vegetables is used to control for seasonality in vegetable prices. The impact of other exogenous variation and endogeneity has also been accounted for by using alternative lags of the target variable in the empirical exercise. | Table 2: Granger Causality Tests | | Period: April 2014 – March 2024 | | Null Hypothesis | P-Value | | Absolute Rainfall Deviation does not Granger Cause CPI Vegetables Momentum | 0.099* | | Absolute Temperature Deviation does not Granger Cause CPI Vegetables Momentum | 0.055* | Note: *: P < 0.10; **: P < 0.05; ***: P < 0.01.
Source: RBI staff estimates. | The empirical exercise is divided into four parts. As an initial check, causality has been identified between the variables using the Granger causality tests (Granger, 1969), which indicate unidirectional causality from weather anomalies to vegetable prices (Table 2), setting the stage to formally investigate the impact of weather anomalies on vegetable prices using alternate modelling approaches. Under second step, a multiple linear regression modelling framework has been adopted to investigate the statistical significance of weather anomalies in impacting vegetable prices, controlling for movements in market arrivals and reservoir level. where, Yt = Target variable at time t, i.e., CPI Vegetables Momentumt, Zit represents control variables representing reservoir level deviation and market arrivals momentum Xit represents impact variables representing rainfall and temperature deviation α and β are coefficients, m and n are number of controls and impact variables, C = Constant term and et = Error. Third, vector autoregression (VAR) model has also been employed following the similar structure as in the multiple regression model to account for the possible endogeneity in the variables and to check the robustness of the results. The impulse response functions (IRFs) generated from the VAR model can help understand the duration of the impact of weather anomalies on vegetable prices. The VAR model is represented by the following i = m equations: where, Ci = Intercept (constant term) for equation i, Xs represent m endogenous variables with lag structure n, Zs represent w exogenous variables, α and β are coefficients of endogenous and exogenous variables, and et = Error. And finally, 60-month rolling window estimates of the regression model are generated to visualise how the impact of weather anomalies on vegetable prices has evolved over time. V. Results The multivariate regression10 results suggest that anomalies in rainfall and temperature have statistically significant effect on vegetable prices (Table 3). The coefficients of the controls, represented by market arrivals and reservoir levels, also turn out to be negative and significant, suggesting that higher market arrivals and reservoir levels help in easing vegetable prices and vice versa. The negative coefficient of the second lag of CPI-Vegetables momentum roughly reflects a two-month crop cycle of vegetables on an average. While market arrivals appear to influence prices in the same period, the reservoir levels seem to take more time to influence prices reflecting the persistence associated with them. | Table 3: Multivariate Regression Results | | Dependent Variable: CPI Vegetables Momentum | Period: April 2014 – March 2024 | | Variable | Coefficient | | Constant | -0.38
(1.15) | | CPI Vegetables Momentumt-1 | 0.17**
(0.08) | | CPI Vegetables Momentumt-2 | -0.21***
(0.07) | | Market Arrivals Index Momentum | -0.06*
(0.03) | | Market Arrivals Index Momentumt-1 | -0.03
(0.03) | | Market Arrivals Index Momentumt-2 | -0.02
(0.03) | | Reservoir Level Deviation | 0.02
(0.10) | | Reservoir Level Deviationt-1 | 0.19
(0.13) | | Reservoir Level Deviationt-2 | -0.22**
(0.09) | | Rainfall Absolute Deviation | -0.02
(0.02) | | Rainfall Absolute Deviationt-1 | -0.02
(0.02) | | Rainfall Absolute Deviationt-2 | 0.07***
(0.02) | | Temperature Absolute Deviation | -0.97
(1.24) | | Temperature Absolute Deviationt-1 | 2.60**
(1.28) | | Temperature Absolute Deviationt-2 | -0.98
(1.27) | | R2 | 0.48 | | Adjusted R2 | 0.41 | | Durbin Watson Statistic | 1.70 | Notes: 1. The model includes a time dummy for July 2023 when vegetable prices witnessed sharp uptick.
2. Figures in parentheses are standard errors.
3. *: P < 0.10; **: P < 0.05; ***: P < 0.01.
Source: RBI staff estimates. | The regression estimates indicate that one-unit increase in rainfall and temperature deviations add 0.07 and 2.60, respectively, to the CPI-Vegetables momentum, on an average. The smaller coefficient of rainfall than that of temperature is a statistical phenomenon, reflecting the large-sized absolute deviations in rainfall (averaging around 17.7 for the study period) compared to that of temperature (averaging around 0.5 only). Using these average deviations and significant coefficients, the average impact turns out to be around 1.24 and 1.30 percentage points to the CPI-Vegetables momentum from rainfall and temperature anomalies, respectively. The current price changes, led by movements in market arrivals, can influence farming decisions and further crop sowing, which in turn, can possibly impact the resulting market arrivals in the next cycle. To account for the possible simultaneity and endogeneity across variables and as a robustness check, VAR model11 has also been employed following the similar lag structure as in the multiple regression model. The impulse response functions (IRFs)12, like earlier results, suggest that shocks to rainfall deviation and temperature deviation carry significant impact on vegetable prices (Chart 4). 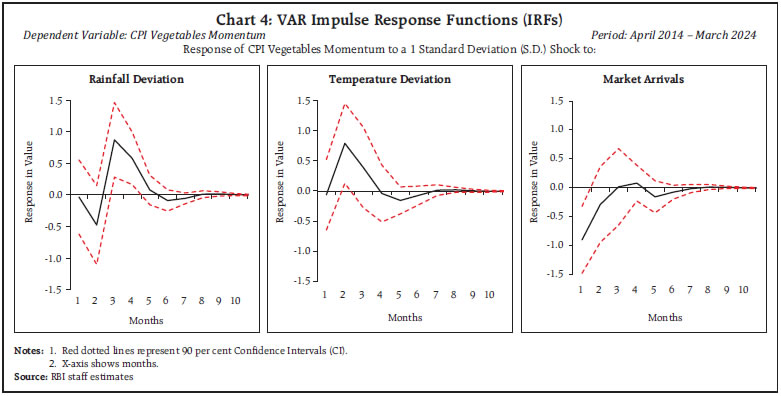 Further, the impact of shocks to rainfall and temperature appears to be different in terms of timing and duration, while their combination can be highly detrimental and inflationary. The temperature anomalies seem to carry a more immediate impact on vegetable prices in comparison to rainfall vagaries. This can be attributed to the fact that abnormal temperatures generally carry direct impact on crop growth process at all stages. On the other hand, the impact of rainfall is more dynamic in nature and may also bring changes to irrigation activities and water availability from other resources over the crop growth period and hence, the repercussions could be seen generally in longer duration. The rolling estimates of the regression model suggest that the coefficients of both rainfall and temperature deviation have changed over time (Chart 5). The coefficients associated with the significant lags have remained largely positive for the whole study period. The coefficient of the significant lag of temperature deviation has increased on sustained basis since 2022 reflecting the increasing importance of temperature movements in influencing vegetable prices. VI. Conclusion Tracking and understanding the drivers of food inflation is of high importance in India due to high share of the food and beverages items in CPI and their important macroeconomic and welfare-related implications. While India is the major producer of vegetables in the world, most of the production comes from small and marginal farmers with very little or no safeguard against weather disturbances. Therefore, weather anomalies can potentially cause disturbances to short-term supply of vegetables and induce large price fluctuations, which can drive volatility in food inflation. Given the high sensitivity of vegetables and their prices to weather shocks in India, which have seen a considerable volatility owing to climate change in recent years, the study investigates the impact of weather anomalies on vegetable prices and how their impact has changed over time. The empirical results suggest that weather anomalies carry statistical significance, and disturbances in both rainfall and temperatures increase pressures to vegetable prices in India. Moreover, the increasing significance of temperature shocks and their more immediate impact on vegetable prices calls for increased attention towards faster adoption of temperature-resistant crop varieties, which can be supported by policy interventions like National Mission on High Yielding Seeds announced in the Union Budget 2025-26. The study faces some limitations like unavailability of high frequency data on production and sowing. Moreover, while market arrivals control for major supply-side factors including government interventions, use of dummies to identify for specific government interventions involving certain vegetables can minimise the possibility of omitted variable bias and further enhance the empirical exercise. References: Adam, C., Kwimbere, D., Mbowe, W., and O’Connell, S. (2012). Food Prices and Inflation in Tanzania. African Development Bank Groups Working Paper, International Growth Centre (IGC), July. Bal, S. K., Prasad, J. V. N. S., and Singh, V. K. (2022). Heat wave 2022 Causes, Impacts and Way Forward for Indian Agriculture. Technical Bulletin No. ICAR/CRIDA/TB/01/2022, ICAR-Central Research Institute for Dryland Agriculture, Hyderabad, Telangana, India, p50. Brown, M. E., and Kshirsagar, V. (2015). Weather and International Price Shocks on Food Prices in the Developing World. Global Environmental Change, 35, 31-40. Cachia, F. (2014). Nowcasting Regional Consumer Food Inflation. Food and Agriculture Organisation of the United States Working Paper Series, ESS/14-07. Dilip, A., & Kundu, S. (2020). Climate Change: Macroeconomic Impact and Policy Options for Mitigating Risks. RBI Bulletin, 74(4), 105-125. Furuya, J., and Kobayashi, S. (2009). Impact of Global Warming on Agricultural Product Markets: Stochastic World Food Model Analysis. Sustainability Science, 4(1), 71-79. Ghosh, S., Kundu, S., & Dilip, A. (2021). Green Swans and their Economic Impact on Indian Coastal States. Reserve Bank of India Occasional Papers, 42(1), 1-69. Gonzalez, J. A., Juarez-Torres, M., and Zazueta Borboa, F. (2023). Temperature Shocks and Their Effect on The Price of Agricultural Products: Panel Data Evidence from Vegetables in Mexico. Working Paper No. 2023- 02, Banco de México. Granger, C. W. (1969). Investigating Causal Relations by Econometric Models and Cross-Spectral Methods. Econometrica, 424-438. IMD. (2024). Updated Seasonal Outlook for Hot Weather Season (April to June) 2024 and Monthly Outlook for April 2024 for the Rainfall and Temperature. IMF. (2022). Countering The Cost-Of-Living Crisis. World Economic Outlook, October 2022, International Monetary Fund (IMF). Lesk, C., Rowhani, P., and Ramankutty, N. (2016). Influence of Extreme Weather Disasters on Global Crop Production. Nature, 529(7584), 84-87. Letta, M., Montalbano, P., and Pierre, G. (2022). Weather Shocks, Traders’ Expectations, and Food Prices. American Journal of Agricultural Economics, 104(3), 1100-1119. Madaan, L., Sharma, A., Khandelwal, P., Goel, S., Singla, P., and Seth, A. (2019). Price Forecasting and Anomaly Detection for Agricultural Commodities in India. In Proceedings of the 2nd ACM SIGCAS Conference on Computing and Sustainable Societies, 52-64. Odongo, M. T., Misati, R. N., Kamau, A. W., and Kisingu, K. N. (2022). Climate change and Inflation in Eastern and Southern Africa. Sustainability, 14(22), 14764. Potopová, V., Zahradníček, P., Štěpánek, P., Türkott, L., Farda, A., and Soukup, J. (2017). The Impacts of Key Adverse Weather Events on the Field-Grown Vegetable Yield Variability in the Czech Republic from 1961 to 2014. International Journal of Climatology, 37(3), 1648-1664. Rashid, M., Hussain, K., Malik, A. A., Narayan, S., Nazir, G., and Mazahir, S. (2020). Impact of Climate Change on Vegetable Crops and its Mitigation. International Journal of Current Microbiology and Applied Sciences, Special Issue-11, 2429-2445. RBI. (2017). Monetary Policy Report, October. RBI. (2020). Monetary Policy Report, April. RBI. (2021). RBI Annual Report 2020-21. RBI. (2023a). Monetary Policy Report, October. RBI. (2023b). Report on Currency and Finance 2022-23. Sekhar, C. S. C., Roy, D., and Bhatt, Y. (2018). Food Inflation and Volatility in India: Trends and Determinants. Indian Economic Review (2018) 53:65–91. Singh, C., Das, S., Verma, R. B., Verma, B. L., & Bandyopadhyay, B. K. (2012). Rainfall Estimation of Landfalling Tropical Cyclones Over Indian Coasts Through Satellite Imagery. Mausam, 63(2), 193-202. The Economic Survey 2024-25. Chapter 4: Prices and Inflation: Understanding The Dynamics, Government of India. Venkat, A., Masters, W., and Naumova, E. (2022). Extreme Weather Events Differentially Impact Retail Food Prices: Evidence from Early Warning Systems. Current Developments in Nutrition, 6, 82. Yang, H., Cao, Y., Shi, Y., Wu, Y., Guo, W., Fu, H., and Li, Y. (2022). The Dynamic Impacts of Weather Changes on Vegetable Price Fluctuations in Shandong Province, China: An Analysis Based on VAR and TVPVAR models. Agronomy, 12(11), 2680.
Annex | Table A1: Producing States and Cropping Pattern of Major Vegetables in CPI | | CPI Weight | Item | Major Producing States | Sowing Season | Harvesting Time or Cycle Length | | 0.98 | potato | Uttar Pradesh, West Bengal, Bihar, and Gujarat | May-June (Kharif) Mid Sep-Nov (Rabi) | Sep-Nov (Kharif) Dec-Mar (Rabi) (Around 3-4 months) | | 0.64 | onion | Maharashtra, Madhya Pradesh, Karnataka, Gujarat, and Rajasthan | Jul-Aug, Oct-Nov (Kharif and Late Kharif) Dec-Jan (Rabi) | Oct-Dec, Jan-Mar (Kharif and Late Kharif) End of Mar-May (Rabi) (Around 3-4 months) | | 0.57 | tomato | Andhra Pradesh, Madhya Pradesh, Karnataka, Telangana, and Gujarat | May-July (Kharif) Oct-Feb (Rabi) | July-Nov (Kharif) Dec-Jun (Rabi) (Around 2-3 months) | | 0.44 | palak/other leafy vegetables | Uttar Pradesh, Andhra Pradesh, Telangana, Kerela, Tamil Nadu, Karnataka, Maharashtra, West Bengal, and Gujarat | Whole year except December, January, and monsoon months | Around 2 months | | 0.37 | brinjal | West Bengal, Orissa, Gujarat, Bihar, Madhya Pradesh | Whole year except December, March, April, August, and September | Around 2-5 months | | 0.31 | garlic | Madhya Pradesh, Rajasthan, Uttar Pradesh, Gujarat, Punjab, and Maharashtra | June-July (Kharif), Sep-Nov (Rabi) | Oct-Nov (Kharif) March-May (Rabi) (Around 4-6 months) | | 0.28 | green chillies | Andhra Pradesh, Madhya Pradesh, Karnataka, Maharashtra, and Tamil Nadu | May-June (Kharif), Sep-Oct (Rabi) Jan-Feb (Summer) | Sep-Oct (Kharif) Jan-Feb (Rabi) May-June (Summer) (Around 3-4 months) | | 0.25 | cauliflower | West Bengal, Madhya Pradesh, Bihar, Gujarat, and Orissa | May-June | Sep-Jan (Around 3-4 months) | | 0.19 | ginger | Madhya Pradesh, Karnataka, Orissa, West Bengal, and Assam | Feb-May | July-Aug (Around 5-6 months) | | 0.18 | cabbage | West Bengal, Orissa, Madhya Pradesh, Gujarat, and Uttar Pradesh | Aug-Nov | Nov-Dec (Around 3-4 months) | | Sources: Horticulture Statistics at a Glance 2018 edition; Agriculture Statistics at a Glance 2022 edition; multiple other online platforms; and RBI staff representation. |
| Table A2: Information and Sources | | Information | Source | | CPI Vegetables | National Statistics Office (NSO), MoSPI, GoI | | Temperature | Indian Meteorological Department (IMD), GoI | | Rainfall | | Reservoir Level | Centre for Monitoring Indian Economy (CMIE) | | Market Arrivals | Agmarknet, MAFW, GoI |
| Table A3: Variables and Stationarity | | Period: April 2014 – March 2024 | | Variable Form | ADF Test Statistic | P-Value | Result | | CPI Vegetables Inflation (y-o-y) | -2.51 | 0.12 | Non-stationary | | CPI Vegetables Momentum (m-o-m) | -9.12 | 0.00 | Stationary*** | | Temperature (Absolute Deviation from LPA) | -6.20 | 0.00 | Stationary*** | | Rainfall (Absolute Deviation from LPA) | -7.90 | 0.00 | Stationary*** | | Reservoir Level (Deviation from LPA) | -2.95 | 0.04 | Stationary** | | Market Arrivals Index Momentum | -8.75 | 0.00 | Stationary*** | Notes: 1. Augmented Dickey Fuller Test (ADF) is used for the stationarity checks.
2. *: P < 0.10; **: P < 0.05; ***: P < 0.01.
Source: RBI staff estimates. |
|